Research
The main research topics of our group are described below. Note: For an up-to-date overview, see publications.
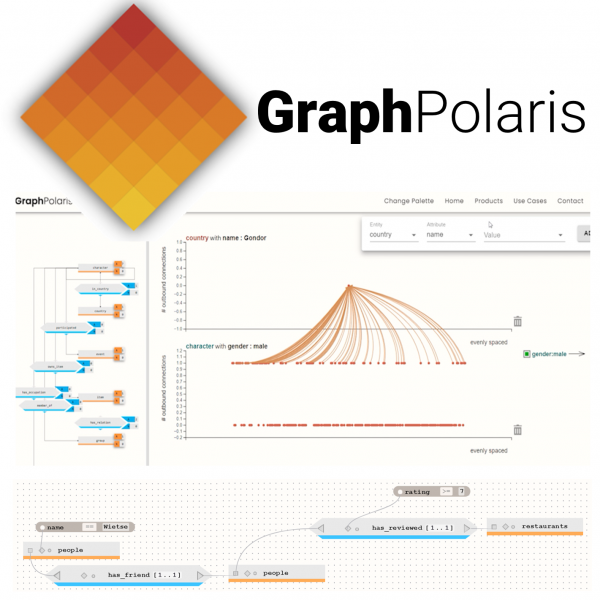
| (Knowledge) Graph Data Analytics Graph databases store data together with its accompanying relationships. This allows us to model non-trivial, e.g., multi-relational or (in)direct deep relationships, such as the ones occurring in multi-omics data, fraud analysis, or sustainable supply chains. We work on building better and visually-driven graph analytics approaches targeting the challenge of Multivariate Network Visualization/Analysis. We develop GraphPolaris, a no-code analytics platform for graph analysis, that enables scientists to contribute their domain knowledge and analyze large and complex datasets without query scripting and explore results via compelling visualizations. For this project, we are actively searching for BSc/MSc students, who are interested in research and development. If you are interested contact Michael Behrisch. | |
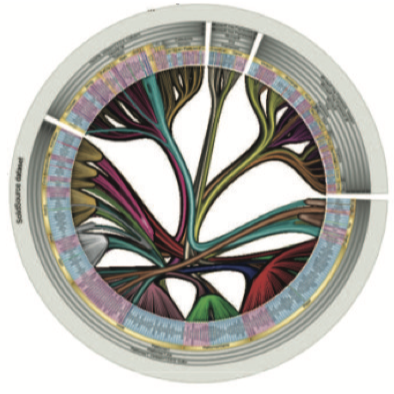
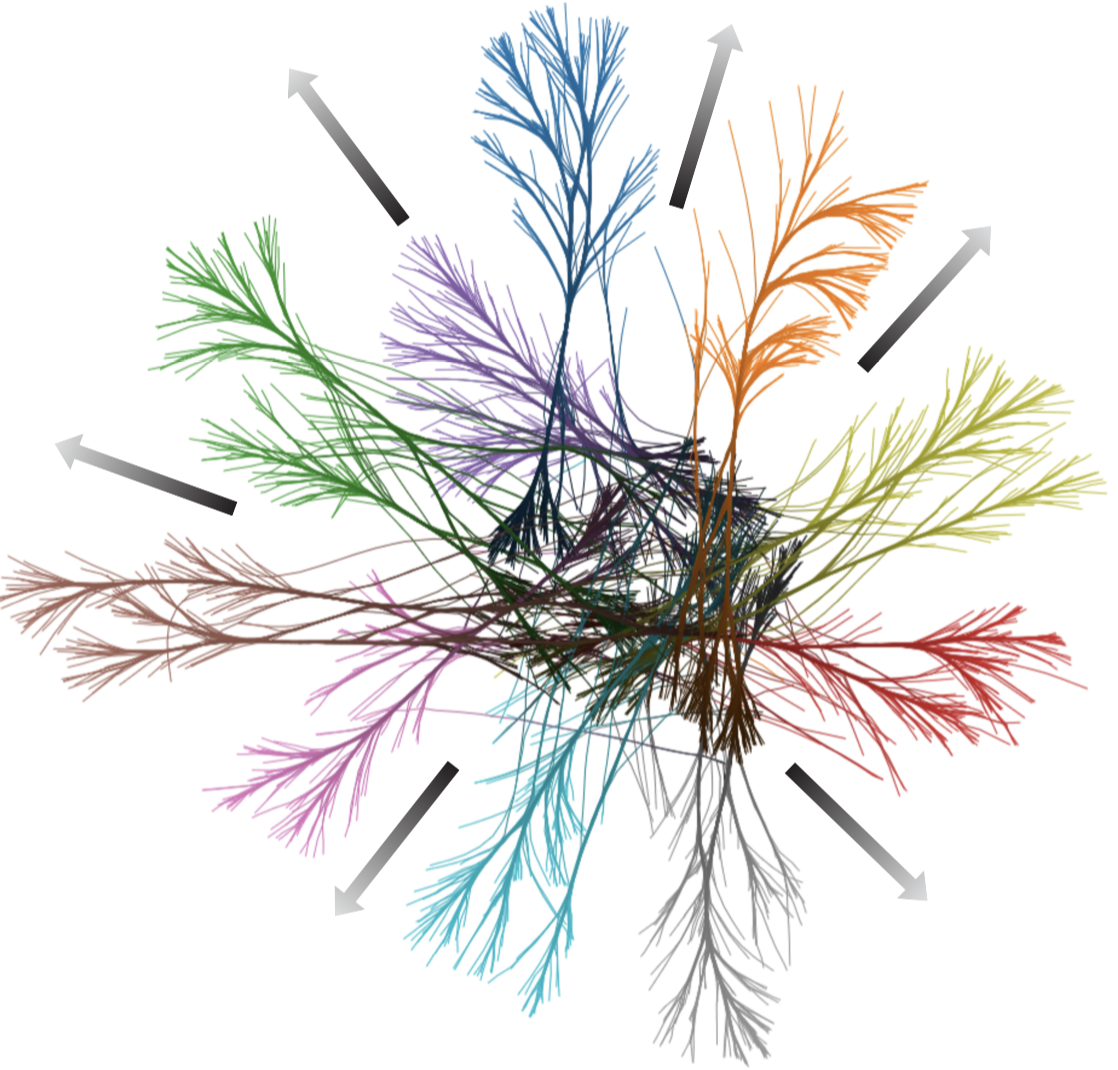
| Information Visualization Information visualization is used to depict and explore non-spatial data in a visual way using good visual metaphors and efficient interaction techniques. Our research focuses on large multivariate graph and trail-set simplified visualization via bundling, image-based techniques for non-spatial data, and high-dimensional data visualization and via dimensionality reduction. To approach all these challenges, we design new scalable InfoVis techniques and tools using GPU programming. At a higher level, we am working on theory, techniques, and tools to unify scientific visualization and information visualization via imaging and computer graphics. | |
| Visual Analytics Visual analytics aims at generating and proving hypotheses to support understanding of complex phenomena based on large data sets. Visual analytics is tightly connected with data science, data mining, and machine learning. My research focuses on supporting machine learning engineering by explaining the operation of complex engines such as classifiers and providing interactive tools to incorporate user insights into their design and optimization processes. At a high level, my aim is to empower both machine learning engineers with tools that aid them to design and fine-tune their engines, and end-users of these tools in understanding how and why machine learning took its decisions. | |

| Virtual Reality Virtual and augmented realities provide additional input and depiction modalities atop of what typical 2D computer interfaces offer. We explore these virtual modalities to enable a wide range of applications - from depicting high-dimensional and relational data to improving the treatment of various medical conditions and supporting patient care. | |
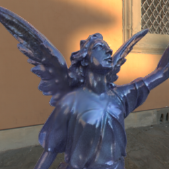
| Realistic Rendering Realistic material appearance in virtual worlds requires huge work at all stages of the rendering pipeline. A user-centric approach is needed to focus efforts on how materials are perceived. We aim to develop a comprehensive model of the human visual perception of materials. This involves characteristics such as color, gloss, texture, transparency, refraction, and translucency. | |
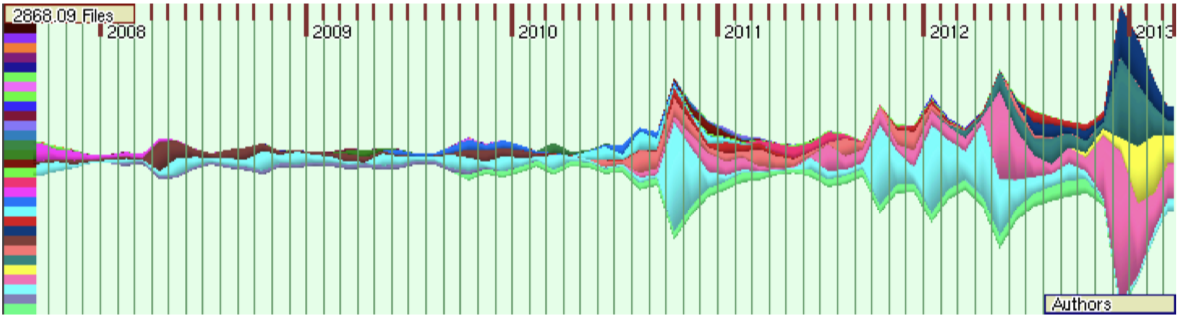
| Software Visualization and Data Mining Software visualization methods help understanding and maintaining large and complex code bases by presenting the structure, attributes, and evolution of source code in scalable and intuitive ways. We develop methods that extract various kinds of information from source code, program traces, and software repositories: dependencies, structure, quality metrics, and developer activity. I next develop tools to show, navigate, and query all this information. Weimplement these methods in tools that are used on real-world software systems. | |
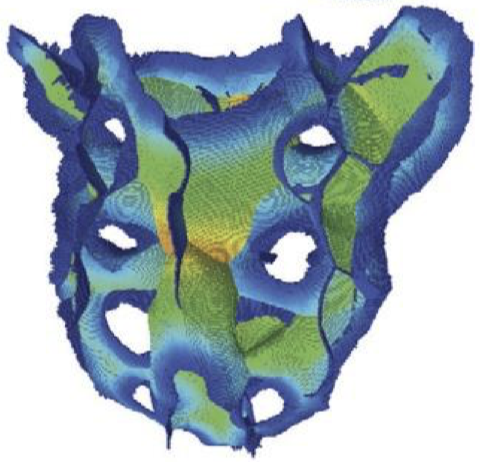
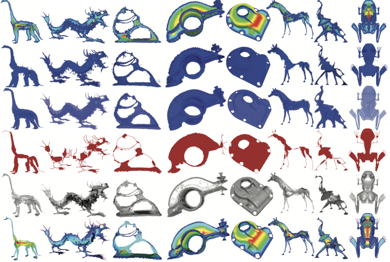
| Multiscale Shape and Field Processing Multiscale processing involves 2D and 3D shape segmentation, denoising, edge and feature detection, simplification, and matching done on several levels of detail, as well as processing several 2D or 3D fields such as scalar, vector, or tensor. These operations can be effectively and efficiently supported by several classes of methods: skeletonization (or medial axis computation), level sets, and partial differential equations. Applications include image and volume inpainting, surface reconstruction from point clouds, image and volume compression, shape segmentation shape denoising and simplification, and flow simulation. | |
| Surveys and Benchmarks State-of-the-art reports present major developments over one or more decades in a research subfield. Benchmarks compare methods, techniques, and tools to help practitioners to choose optimal ones for a given context. Both instruments are vital to help researchers and practitioners with hard, replicable, facts and recipes in the ever-expanding jungle of methods, papers, and tools. We have worked on several surveys and benchmarks on the above-described areas of our research. |