Our mission is to empower experts, as well as non-data scientists, to solve big data problems through visualizations, interaction concepts, data mining techniques, and realistic rendering methods.
|
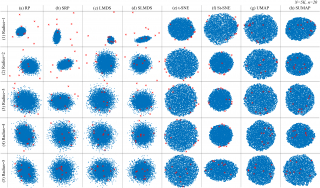
| D. Atzberger, T. Cech, W. Scheibel, J. Döllner, M. Behrisch, T. Schreck (2025) A Large-Scale Sensitivity Analysis on Latent Embeddings and Dimensionality Reductions for Text Spatializations
   
|
|
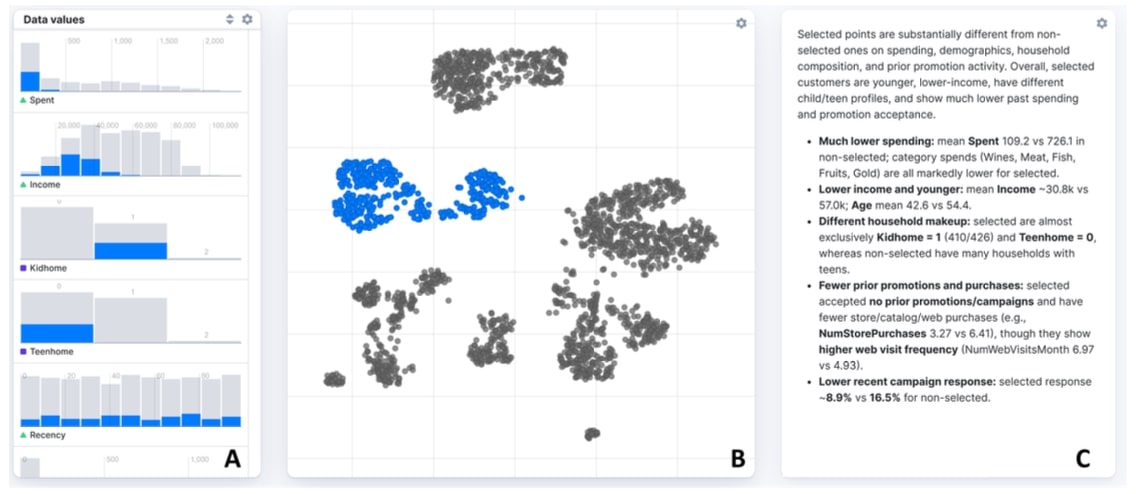
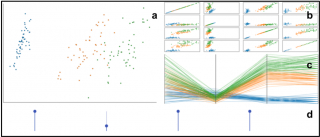
| R. Buchmüller, D. Collaris, L. Meng, A. Chatzimparmpas (2025) LangLasso: Interactive Cluster Descriptions Through LLM Explanation. 1st Workshop on GenAI, Agents, and the Future of Visualization (VIS Workshop)
|
|
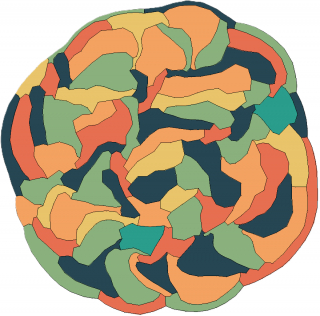
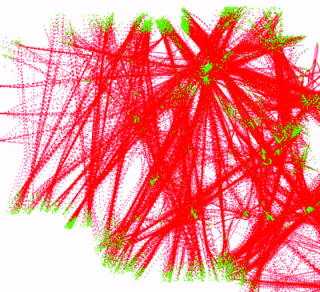
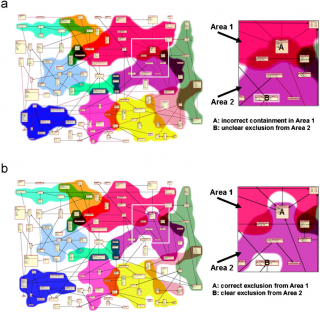
| E. Katsanou, T. Mchedlidze, A. Symvonis, T. Tolias (2025) An Algorithm for Accurate and Simple-Looking Metaphorical Maps. In 33rd International Symposium on Graph Drawing and Network Visualization, GD 2025. Schloss Dagstuhl - Leibniz-Zentrum für Informatik, pages 40:1-40:17

|
|
| A. Chatzimparmpas (2025) Visual Analytics for Explainable and Trustworthy Artificial Intelligence. IEEE Computer Graphics and Applications 45(2):100-111
|
|
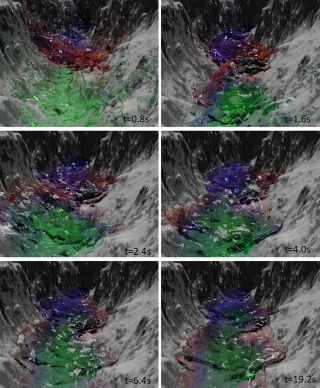
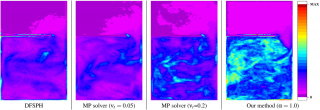
| Y. Zhang, Y. Xu, X. Wang, A. Chatzimparmpas, X. Ban (2025) Decoupling Density Dynamics: A Neural Operator Framework for Adaptive Multi-Fluid Interactions. Computer Animation and Virtual Worlds 36(3):e70027
|
|
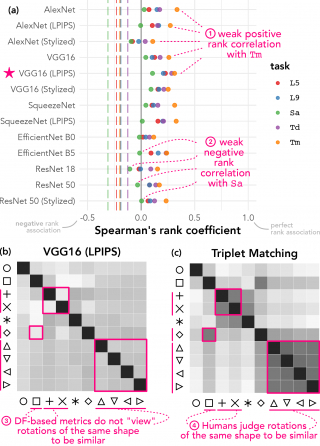
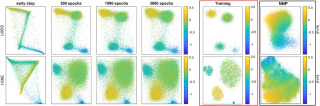
| S. Long, A. Chatzimparmpas, E. Alexander, M. Kay, J. Hullman (2025) Seeing Eye to AI? Applying Deep-Feature-Based Similarity Metrics to Information Visualization. In Proc. ACM CHI. Association for Computing Machinery
|
|
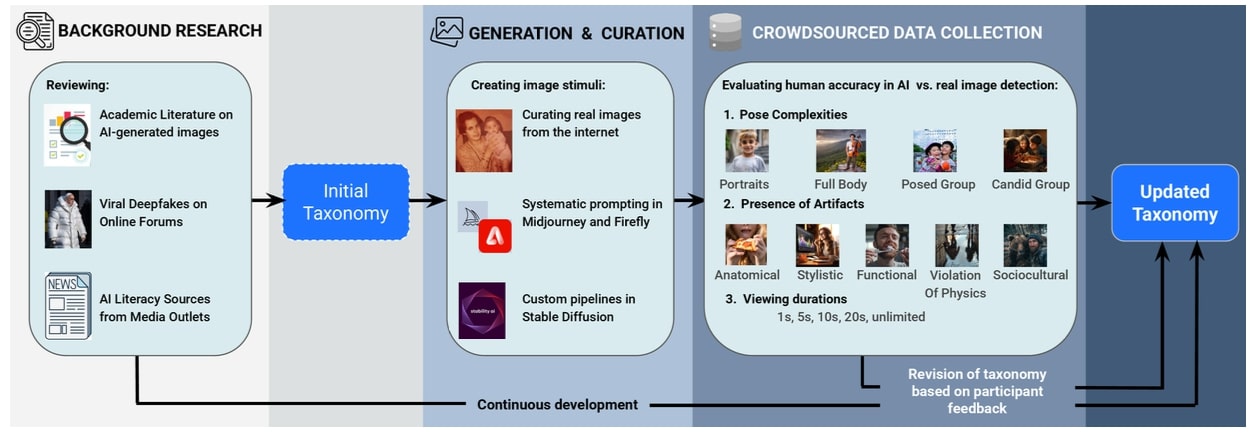
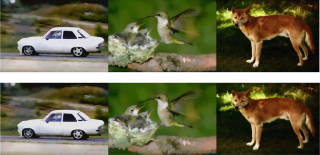
| N. Kamali, K. Nakamura, A. Kumar, A. Chatzimparmpas, J. Hullman, M. Groh (2025) Characterizing Photorealism and Artifacts in Diffusion Model-Generated Images. In Proc. ACM CHI. ACM
|
|
| Z. Hochman, A. Chatzimparmpas, D. Gold (2025) An Interactive Visual-Analytic System to Support Dynamic and Adaptive Infrastructure Pathways for Urban Water Supply Planning. EGU General Assembly 2025 (EGU25-17679, Vienna, Austria, 27 Apr--2 May 2025)
|
|
| D.E. Verboom, T. Mchedlidze, B. Oral, E. Dimara, D.P. Rebelo, N. Kamoen, C.X. Bearfield (2025) Visualizing Opinion Space in Voting Advice Applications: A User Study. In Proc. IEEE Visualization (short Papers) (preprint)
|
|
| J. Wang, H. Wang, X. Wang, Y. Zhang, J. Kosinka, S. Frey, A. Telea, X. Ban (2025) Peridynamics-based Simulation of Viscoelastic Solids and Granular Materials. Computers & Graphics 133(104663)
|
|
| J. Almeida, C. Freitas, N. Sebe, A. Telea (2025) Foreword to the Special Section on SIBGRAPI 2024. Pattern Recognition Letters 198:123-124
|
|
| X. Ye, X. Wang, Y. Xu, A.C. Telea, J. Kosinka, L. You, J. Zhang, J. Chang (2025) Dynamic Importance Monte Carlo SPH Vortical Flows with Lagrangian Samples. IEEE TVCG (in press)
|
|
| M.A. Cerqueira, A. Telea, A. Falcão (2025) Towards to the Evaluation of FLIM Attention Regions. In Proc. SIBGRAPI - Work in Progress
|
|
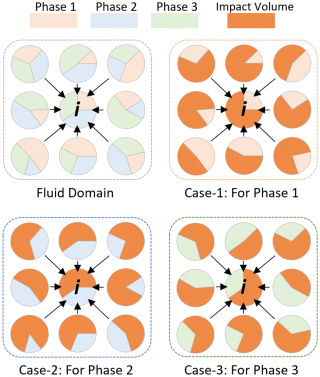
| R. Li, X. Wang, Y. Xu, Y. Zhang, J. Kosinka, A. Telea, J. Chang, J. Zhang, X. Ban (2025) Multiphase Particle-Based Simulation of Poro-Elasto-Capillary Effects. In Proc. SIGGRAPH Asia
|
|
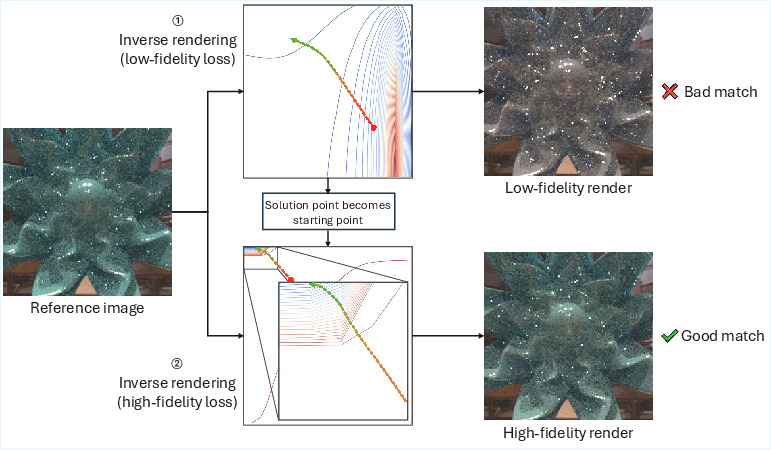
| V. Stenvers, P. Vangorp (2025) Multi-Fidelity Optimization for Inverse Material Rendering. In ACM SIGGRAPH European Conference on Visual Media Production (CVMP)
|
|
| I. Hartskeerl, T. Nijboer, P. Vangorp, A. Telea (2025) The Use of Virtual/Augmented/Mixed Reality in the Rehabilitation of Hemianopia and Visuospatial Neglect Patients: A Systematic Review. In Proc. XR Neglect (Abstract)
|
|
| M. Dossi, A.C. Telea, T.C.W. Nijboer, F.W. Cornelissen, A. Chatzimparmpas (2025) Visual Analytics for Explainable Visual Rehabilitation. In Proc. $2^{nd}$ European Symposium on XR Technologies for Neurorehabilitation of Spatial Neglect
|
|
| F. Du, Y. Zhang, Y. Ji, X. Wang, C. Yao, J. Kosinka, S. Frey, A. Telea, X. Ban (2025) GaussFluids: Reconstructing Lagrangian Fluid Particles From Videos Via Gaussian Splatting. In Proc. PacificGraphics
|
|
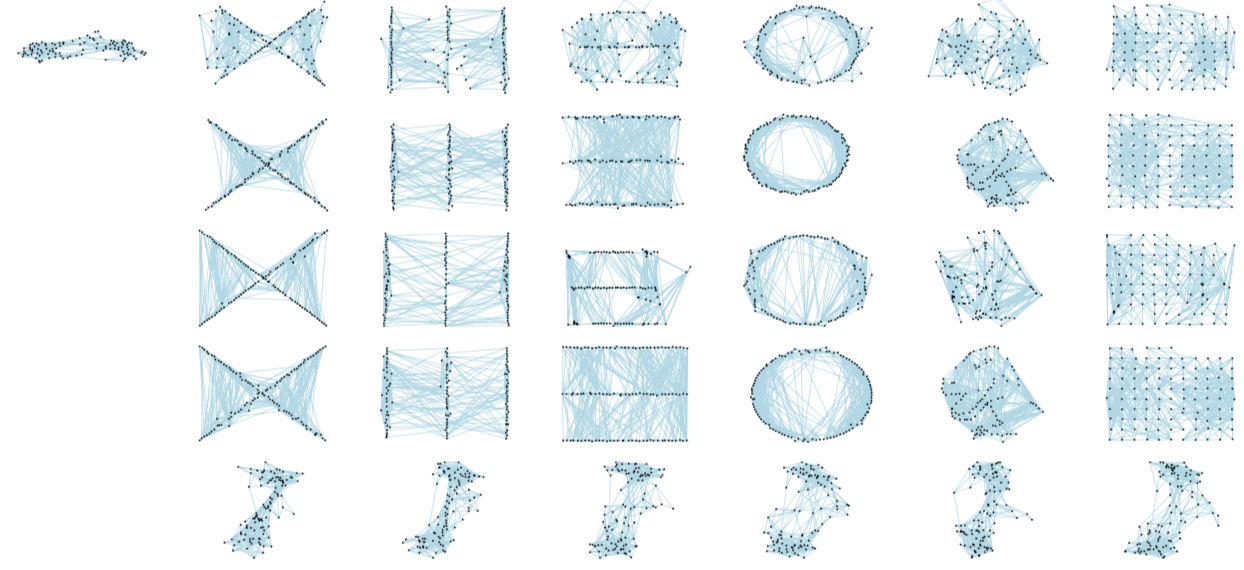
| I. Hartskeerl, T. Mchedlidze, S. van Wageningen, P. Vangorp, A. Telea (2025) NNP-NET: Accelerating T-SNE Graph Drawing for Very Large Graphs by Neural Networks. In Proc. Graph Drawing
|
|
| S. van Wageningen, T. Mchedlidze, A. Telea (2025) Same Quality Metrics, Different Graph Drawings. In Proc. Graph Drawing
|
|
| A.A. Oliveira, M. Espadoto, R. Hirata, R.M. Cesar, A. Telea (2025) Creating User-steerable Projections with Interactive Semantic Mapping. arXiv:2506.15479 [cs.LG]
|
|
| A. da Silva, E.F. Ribeiro, J.R. Dalenberg, E.F. Vernier, A.C. Telea, M.A.J. Tijssen, J. Comba (2025) Hyperkinetic Movement Disorder Analysis Using Multidimensional Projections. Computers & Graphics 131
|
|
| J. Wang, H. Wang, X. Wang, Y. Zhang, J. Kosinka, S. Frey, A. Telea, X. Ban (2025) Peridynamics-Based Simulation of Viscoelastic Solids and Granular Materials. In Proc. CASA/AniNex. Springer
|
|
| A. Machado, M. Behrisch, A. Telea (2025) Extensible TensorFlow Implementations of Projection Quality Metrics. In Proc. VisGap. Eurographics
|
|
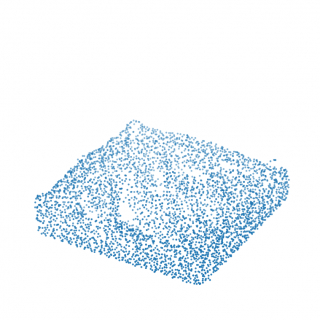
| Y. Zhang, P. Yang, H. Wang, Z. Wu, X. Gu, A. Telea, J. Kosinka (2025) PAD: Detail-preserving Point Cloud Reconstruction and Generation Via Autodecoders. IET Computer Vision 19(1)
|
|
| D. Blumberg, Y. Wang, A. Telea, D. Keim, F. Dennig (2025) MultiInv: Inverting Multidimensional Scaling Projections and Computing Decision Maps by Multilateration. Computers & Graphics 129(104234)
|
|
| Y. Wang, C. Grosu, A. Telea (2025) Computing Fast and Accurate Maps for Explaining Classification Models. Computers & Graphics 129(104230)
|
|
| Y. Yu, T. Becker, P. Schichtel, W. Aigner, A.C. Telea, M. Behrisch (2025) Noops: Nonmyopic Feedback-Driven Pattern Search in Multivariate Time Series
|
|
| Y. Yu, T. Becker, W. Aigner, A.C. Telea, M. Behrisch (2025) Time Series Representation Techniques: A Survey
|
|
| A. Machado, M. Behrisch, A. Telea (2025) Necessary but Not Sufficient: Limitations of Projection Quality Metrics. Computer Graphics Forum 44(3)
|
|
| S. van Wageningen, T. Mchedlidze, A. Telea (2025) Viewpoint Optimization for 3D Graph Drawings. Computer Graphics Forum
|
|
| Y. Wang (2025) Enhanced Decision Maps for Exploring Classification Models. PhD thesis
|
|
| Y. Xu (2025) Smoothed Particle Hydrodynamics for Fluid Simulation in Computer Graphics. PhD thesis
|
|
| Y. Yu (2025) Multivariate Time Series Pattern Search. PhD thesis
|
|
| Y. Wang, A. Telea (2025) Investigating Desirable Properties of Inverse Projections and Decision Maps. Communications in Computer and Information Science
|
|
| R. Buchmüller, B. Jäckl, M. Behrisch, D.A. Keim, F.L. Dennig (2024) CPro: Circular Projections Using Gradient Descent. In EuroVis Workshop on Visual Analytics (EuroVA 2024) (M. El-Assady, H. Schulz, Eds.). Eurographics
|
|
| S.P. Feyer, B. Pinaud, S.G. Kobourov, N. Brich, M. Krone, A. Kerren, M. Behrisch, F. Schreiber, K. Klein (2024) 2D, 2.5D, or 3D? An Exploratory Study on Multilayer Network Visualisations in Virtual Reality. IEEE Trans. Vis. Comput. Graph 30(1):469-479
|
|
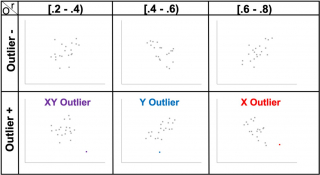
| B. Oral, A. Boduroglu (2024) Effects of Outlier and Familiar Context in Trend-line Estimates in Scatterplots. Memory & Cognition 53(4):1226-1244
|
|
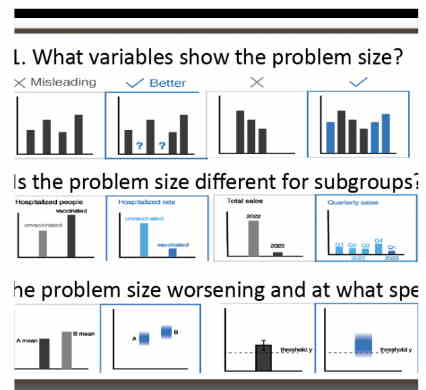
| L.W. Ge, M. Easterday, M. Kay, E. Dimara, P. Cheng, S. Franconeri (2024) V-FRAMER: Visualization Framework for Mitigating Reasoning Errors in Public Policy. In Proc. ACM CHI. ACM
|
|
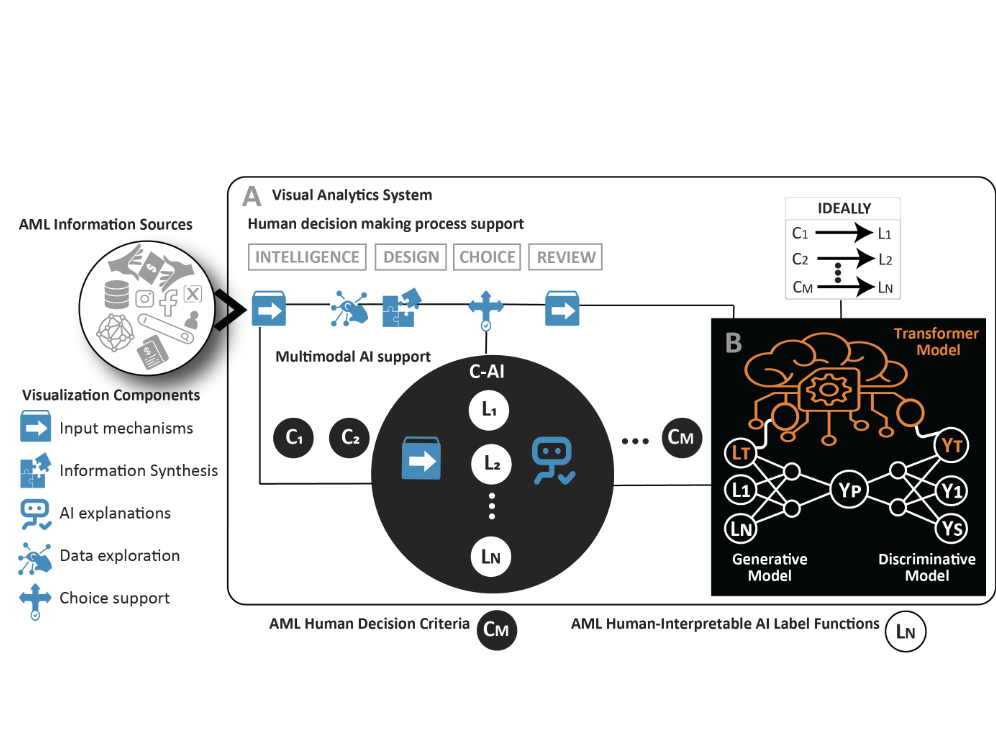
| A. Chatzimparmpas, E. Dimara (2024) Aiding Humans in Financial Fraud Decision Making: Toward an XAI-Visualization Framework. In IEEE VIS 2024 Posters
|
|
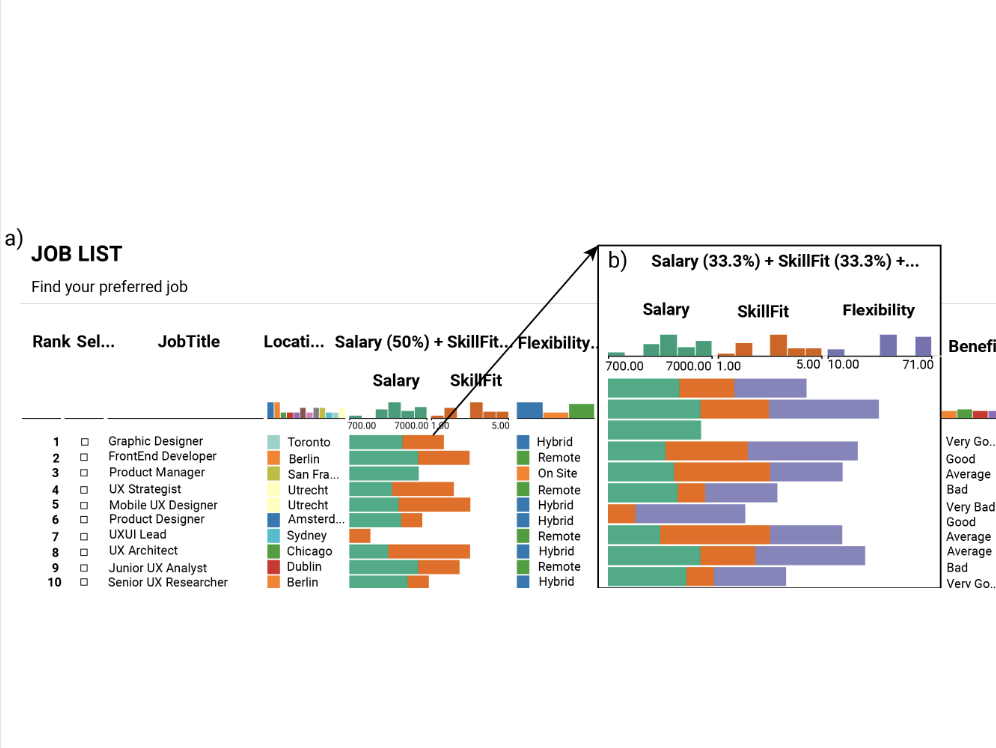
| B. Oral, R. Võeras, E. Dimara (2024) Iterative Quantification of Categorical Criteria for Enhanced Job Seeking. In IEEE VIS 2024 Posters
|
|
| V. Stenvers, P. Vangorp (2024) Image-Based Material Editing Using Perceptual Attributes or Ground-Truth Parameters. In ACM SIGGRAPH European Conference on Visual Media Production (CVMP). ACM
|
|
| X. Wang, Y. Xu, S. Liu, B. Ren, J. Kosinka, A. Telea, J. Wang, C. Song, J. Chang, C. Li, J. Zhang, X. Ban (2024) Physics-based Fluid Simulation in Computer Graphics: Survey, Research Trends, and Challenges. Computational Visual Media 10:803-858
|
|
| A. Chatzimparmpas, R. Martins, A. Telea, A. Kerren (2024) DeforestVis: Behavior Analysis of Machine Learning Models with Surrogate Decision Stumps. Computer Graphics Forum 43(6)
|
|
| B. Oral, P. Dragicevic, A. Telea, E. Dimara (2024) Decoupling Judgment and Decision Making: A Tale of Two Tails. IEEE TVCG 30(10):6928-6940
|
|
| X. Ye, X. Wang, Y. Xu, J. Kosinka, A. Telea, L. You, J. Zhang, J. Chang (2024) Monte Carlo Vortical Smoothed Particle Hydrodynamics for Simulating Turbulent Flows. Computer Graphics Forum 43(2)
|
|
| S. van Wageningen, T. Mchedlidze, A. Telea (2024) An Experimental Evaluation of Viewpoint-Based 3D Graph Drawing. Computer Graphics Forum 43(3)
|
|
| J. Thijssen, Z. Tian, A. Telea (2024) Interactive Tools for Explaining Multidimensional Projections for High-Dimensional Tabular Data. Computers & Graphics 122
|
|
| C. Hurter, A. Telea, B. Rogowitz (2024) Information Visualization: Designing for Usability, User Experience, Sustainability and Inclusion. In Human Computer Interaction: Designing for Usability, Inclusion and Sustainability. (C. Stephanidis, G. Salvendy, Eds.), CRC Press
|
|
| Y. Zhang, S. Long, Y. Xu, X. Wang, C. Yao, J. Kosinka, S. Frey, A. Telea, X. Ban (2024) Multiphase Viscoelastic Non-Newtonian Fluid Simulation. Computer Graphics Forum 43(4)
|
|
| B. Benato, A. Falcão, A. Telea (2024) Linking Data Separation, Visual Separation, Classifier Performance Using Multidimensional Projections. In Springer CCIS 2103, pages 229-255
|
|
| M. Lourens, S. Trager, Y. Kim, A. Telea, J. Roerdink (2024) Supervised Star, Galaxy, and QSO Classification with Sharpened Dimensionality Reduction. Astronomy & Astrophysics
|
|
| Z. Tian, W. Castelein, T. Mchedlidze, A. Telea (2024) Measuring and Interpreting the Quality of 3D Projections of High-Dimensional Data. In Springer CCIS 2103, pages 348-373
|
|
| A. Machado, A. Telea, M. Behrisch (2024) Controlling the Scatterplot Shapes of 2D and 3D Multidimensional Projections. Computers & Graphics 124
|
|
| L. Shen, Y. Zhang, S. Frey, A. Telea, J. Kosinka, X. Wang, X. Ban (2024) Visual Simulation of Bone Cement Blending and Dynamic Flow. In Proc. IEEE BIBM
|
|
| A. Telea, C.M.D.S. Freitas, J. Almeida, N. Sebe (2024) Proc. SIBGRAPI, IEEE
|
|
| Y. Wang, A. Telea (2024) Fundamental Limitations of Inverse Projections and Decision Maps. In Proc. IVAPP, pages 571-582 (Best student paper award)

|
|
| A. Telea, A. Machado, Y. Wang (2024) Seeing Is Learning in High Dimensions: The Synergy Between Dimensionality Reduction and Machine Learning. SN Computer Science 5(3):279
|
|
| C. Grosu, Y. Wang, A. Telea (2024) Computing Fast and Accurate Decision Boundary Maps. In EuroVis Workshop on Visual Analytics (EuroVA) (M. El-Assady, H. Schulz, Eds.). The Eurographics Association
|
|
| A. Machado, M. Behrisch, A. Telea (2024) Exploring Classifiers with Differentiable Decision Boundary Maps. Computer Graphics Forum 43(3):e15109 (Honorable mention paper award) (Publisher: The Eurographics Association and John Wiley & Sons Ltd)

|
|
| D. Blumberg, Y. Wang, A. Telea, D.A. Keim, F.L. Dennig (2024) Inverting Multidimensional Scaling Projections Using Data Point Multilateration. In EuroVis Workshop on Visual Analytics (EuroVA). The Eurographics Association
|
|
| B.C. Benato, C. Grosu, A.X. Falcão, A.C. Telea (2024) Human-in-the-loop: Using Classifier Decision Boundary Maps to Improve Pseudo Labels. Computers & Graphics 124:104062
|
|
| B. Benato, A. Telea, A. Falcão (2024) Pseudo Labeling and Classification of High-Dimensional Data Using Visual Analytics. In Proc. SIBGRAPI WTD (PhD thesis honorable mention award)
|
|
| B.C. Benato (2024) Pseudo Labeling and Classification of High-dimensional Data Using Visual Analytics. PhD thesis
|
|
| Y. Wang, K. Qiu, A.C. Telea, Z. Hou, T. Zhou, Y. Cai, Z. Ding, H. Yu, J. Deng (2024) Interpreting Mineral Deposit Genesis Classification with Decision Maps: A Case Study Using Pyrite Trace Elements. American Mineralogist 109(12):2116-2126
|
|
| Y. Yu, T. Becker, L.M. Trinh, M. Behrisch (2023) SAXRegEx: Multivariate Time Series Pattern Search with Symbolic Representation, Regular Expression, and Query Expansion. Computers & Graphics 112:13-21
|
|
| C. Tominski, M. Behrisch, S. Bleisch, S.I. Fabrikant, E. Mayr, S. Miksch, H. Purchase (2023) Visualizing Uncertainty in Sets
|
|
| Y. Yu, D. Kruyff, J. Jiao, T. Becker, M. Behrisch (2023) PSEUDo: Interactive Pattern Search in Multivariate Time Series with Locality-Sensitive Hashing and Relevance Feedback
|
|
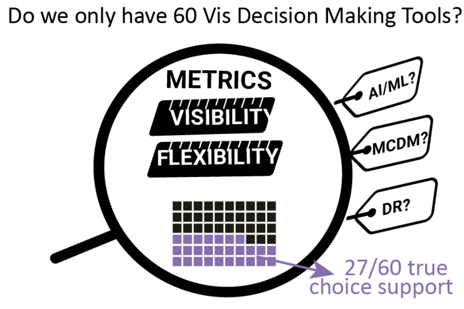
| E. Oral, R. Chawla, M. Wijkstra, N. Mahyar, E. Dimara (2023) From Information to Choice: A Critical Inquiry Into Visualization Tools for Decision Making. IEEE Transactions on Visualization and Computer Graphics
|
|
| M. Espadoto, Y. Kim, S.C. Trager, J. Roerdink, A. Telea (2023) Stabilizing and Simplifying Sharpened Dimensionality Reduction Using Deep Learning. SN Computer Science 4(244)
|
|
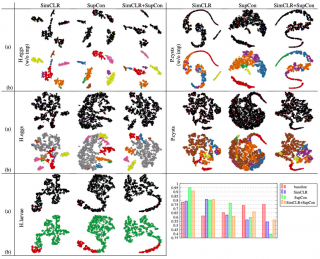
| B. Benato, A. Falcão, A. Telea (2023) Linking Data Separation, Visual Separation, and Classifier Performance Using Pseudo-labeling by Contrastive Learning. In Proc. VISAPP
|
|
| J. Wang, L. de Melo, A. Falcão, J. Kosinka, A. Telea (2023) Spline-Based Dense Medial Descriptors for Image Simplification Using Saliency Maps. In Springer CCIS (1691) Pages 1-24
|
|
| S. van Wageningen, T. Mchedlidze, A. Telea (2023) Identifying Cluttering Edges in Near-Planar Graphs. In Proc. EuroVis (short Papers) (Best short paper award)
|
|
| B. Benato, A. Telea, A. Falcão (2023) Deep Feature Annotation by Iterative Meta-Pseudo-Labeling on 2D Projection. Pattern Recognition
|
|
| J. Chang, X. Wang, A. Telea, J. Kosinka, F. Tian, X. Ban, J. Zhang (2023) Foreword to AniNex Workshop. Computers & Graphics 111
|
|
| X. Liu, P. Yang, A. Telea, J. Kosinka, Z. Wu (2023) PCCNet: A Few-Shot Patch-wise Contrastive Colorization Network. In Proc CGI
|
|
| S. van Wageningen, T. Mchedlidze, A. Telea (2023) Beyond Planarity: A Spring-Based Approach. In Proc. Graph Drawing (posters)
|
|
| M. Espadoto, S. Martins, W. Branderhorst, A. Telea (2023) Machine Learning - Basic Unsupervised Methods (Cluster Analysis Methods, T-SNE) In Clinical Applications of Artificial Intelligence in Real-World Data., Springer
|
|
| Y. Xu, X. Wang, J. Wang, C. Song, T. Wang, Y. Zhang, J. Chang, J. Zhang, J. Kosinka, A. Telea, X. Ban (2023) An Implicitly Stable Mixture Model for Dynamic Multi-fluid Simulations. In Proc. SIGGRAPH Asia, page 6
|
|
| T. Mchedlidze, A. Telea, M. Raab, C. Hurter, N. Melnik, M. Nöllenburg, B. Rogowitz (2023) Perception-Based Framework for Measuring Quality of Graph Visualizations. In Proc. Dagstuhl Seminar 23051
|
|
| A. Telea (2023) In Varietate Concordia: How Software Visualization and Information Visualization Have Evolved From, Around, and Along Each Other (Keynote address)
|
|
| Z. Tian (2023) Explaining Projections of High-Dimensional Data. PhD thesis
|
|
| Y. Kim (2023) Visual Exploration of High-dimensional Data Using Dimensionality Reduction (with Applications in Astronomy) PhD thesis
|
|
| W. Castelein, Z. Tian, T. Mchedlidze, A. Telea (2023) Viewpoint-Based Quality for Analyzing and Exploring 3D Multidimensional Projections. In Proc. IVAPP. SCITEPRESS, pages 65-76 (Best paper award runner-up)
|
|
| A. Telea (2023) Beyond the Third Dimension: How Multidimensional Projections and Machine Learning Can Help Each Other. In Proc. IVAPP. SCITEPRESS, pages 5-16 (Keynote paper)
|
|
| A.A.A.M. Oliveira, M. Espadoto, R. Hirata, A.C. Telea (2023) Stability Analysis of Supervised Decision Boundary Maps. SN COMPUT. SCI 4(3):226
|
|
| S. van den Elzen, G. Andrienko, N. Andrienko, B. Fisher, R. Martins, J. Peltonen, A. Telea, M. Verleysen (2023) The Flow of Trust: A Visualization Framework for Externalizing, Exploring and Explaining Trust in ML Applications. IEEE CG &A 43(2):78-88
|
|
| Y. Wang, A. Machado, A. Telea (2023) Quantitative and Qualitative Comparison of Decision Map Techniques for Explaining Classification Models. Algorithms 16(9):438 (MDPI)
|
|
| Y. Wang, K. Qiu, A. Telea, Z. Hou, H. Yu (2023) Interpreting Machine Learning Models for Geochemistry Data Classification Using Decision Boundary Maps. Technical report EGU23-10228, Copernicus Meetings (Conference Name: EGU23)
|
|
| A. Machado, A. Telea, M. Behrisch (2023) ShaRP: Shape-regularized Multidimensional Projections. In Proc. EuroVA (M. Angelini, M. El-Assady, Eds.). The Eurographics Association (Best paper award) (ISSN: 2664-4487)
|
|
| B.C. Benato, A.X. Falcão, A.C. Telea (2023) Measuring the Quality of Projections of High-dimensional Labeled Data. Computers & Graphics 116:287-297
|
|
| M. Espadoto, F.C.M. Rodrigues, N.S.T. Hirata, A.C. Telea (2023) Visualizing High-dimensional Functions with Dense Maps. SN Computer Science 4(230)
|
|
| J. Thijssen, Z. Tian, A. Telea (2023) Scaling up the Explanation of Multidimensional Projections. In Proc. EuroVA
|
|
| A. Oliveira, M. Espadoto, R. Hirata, N. Hirata, A. Telea (2023) Improving Self-supervised Dimensionality Reduction: Exploring Hyperparameters and Pseudo-labeling Strategies. In Communications in Computer and Information Science. Springer, pages 135-161
|
|
| Y. Yu, T. Becker, M. Behrisch (2022) Multivariate Time Series Retrieval with Symbolic Aggregate Approximation, Regular Expression, and Query Expansion. In Proc. EuroVA (J. Bernard, M. Angelini, Eds.). Eurographics Association (Best paper award)
|
|
| Y. Yu, D. Kruyff, J. Jiao, T. Becker, M. Behrisch (2022) PSEUDo: Interactive Pattern Search in Multivariate Time Series with Locality-Sensitive Hashing and Relevance Feedback. In 24th Eurographics Conference on Visualization, EuroVis 2022 - Posters, Rome, Italy, June 13-17, 2023 (M. Krone, S. Lenti, J. Schmidt, Eds.). Eurographics Association, pages 87-89
|
|
| B. Montambault, C.D. Brumar, M. Behrisch, R. Chang (2022) PIXAL: Anomaly Reasoning with Visual Analytics
|
|
| J. Jiao, H. Brugger, M. Behrisch, W. Eichhammer (2022) Identifying Drivers of Residential Energy Consumption by Explainable Energy Demand Forecasting. In European Council for an Energy Efficient Economy (ECEEEE), Summer Study Proceedings 2022, . ECEEEE
|
|
| E. Giannisakis, E. Dimara, A. Goujon, G. Bailly (2022) Revisiting Menu Design Through the Lens of Implicit Statistical Learning. In Proc. AVI, pages 1-9
|
|
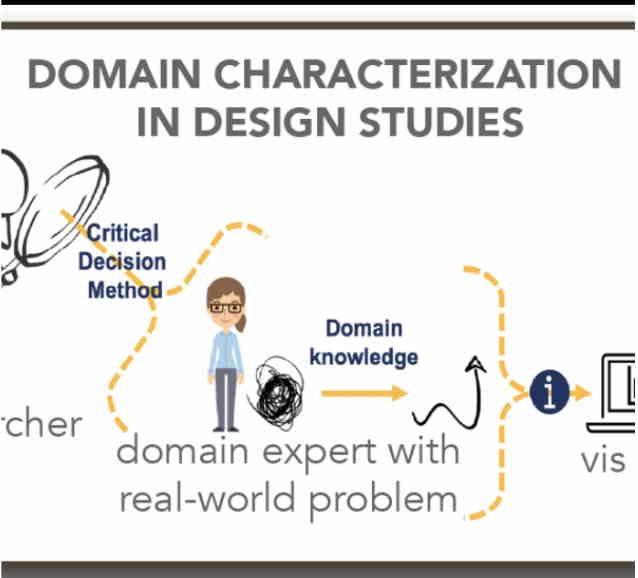
| L. Cibulski, E. Dimara, S. Hermawati, J. Kohlhammer (2022) Supporting Domain Characterization in Visualization Design Studies With the Critical Decision Method. In Visualization Guidelines in Research, Design, and Education (VisGuides Workshop) by IEEE VIS, . Institute of Electrical and Electronics Engineers
|
|
| Y. Kim, A. Telea, S. Trager, J. Roerdink (2022) Visual Cluster Separation Using High-Dimensional Sharpened Dimensionality Reduction. Information Visualization 21(3):197-219
|
|
| G. Appleby, M. Espadoto, R. Chen, S. Goree, A. Telea, E. Anderson, R. Chang (2022) HyperNP: Interactive Visual Exploration of Multidimensional Projection Hyperparameters. Computer Graphic Forum 41(3):169-181
|
|
| A. Telea, M. Behrisch (2022) Visual Exploration of Large Multidimensional Trajectory Data. In Data Science for Migration and Mobility Studies. (A. Salah, E. Korkmaz, T. Bircan, Eds.), Oxford Univ. Press
|
|
| J. Wang, D. da Silva, J. Kosinka, A. Telea, R. Hashimoto, J. Roerdink (2022) Interactive Image Manipulation Using Morphological Trees and Spline-based Skeletons. Computers & Graphics 108:61-73
|
|
| X. Zhai, L. Yu, X. Chen, A. Telea (2022) Skeleton-and-Trackball Interactive Rotation Specification for 3D Scenes. In Communication in Computer and Information Sciences. Springer, pages 26-52
|
|
| T.S. Modrakowski, M. Espadoto, A.X. Falcão, N.S.T. Hirata, A. Telea (2022) Improving Deep Learning Projections by Neighborhood Analysis. In Computer Vision, Imaging and Computer Graphics Theory and Applications (K. Bouatouch, A.A. de Sousa, M. Chessa, A. Paljic, A. Kerren, C. Hurter, G.M. Farinella, P. Radeva, J. Braz, Eds.), pages 127-152. Springer International Publishing (Series Title: Communications in Computer and Information Science)
|
|
| Y. Wang, K. Qiu, Z. Hou, H. Yu (2022) Quartz Ti/Ge-P Discrimination Diagram: A Machine Learning Based Approach for Deposit Classification. Acta Petrol. Sin 38(1):281-290
|
|
| X. Zhai (2022) Exploring and Explaining 3D Data Representations. PhD thesis
|
|
| J. Wang (2022) Dense Medial Descriptors for Image Compression and Manipulation. PhD thesis
|
|
| E. Vernier (2022) Visualization of Multidimensional and Hierarchical Datasets. PhD thesis
|
|
| A.A.A.M. Oliveira, M. Espadoto, R. Hirata Jr, A.C. Telea (2022) SDBM: Supervised Decision Boundary Maps for Machine Learning Classifiers. In Proc. IVAPP, pages 77-87 (Best student paper award)
|
|
| C. Bredius, Z. Tian, A. Telea (2022) Visual Exploration of Neural Network Projection Stability. In Proc. MLVis
|
|
| H. Wang, J. Li, A. Telea, J. Kosinka, Z. Wu (2022) USTNet: Unsupervised Shape-to-Shape Translation Via Disentangled Representations. Computer Graphics Forum 41(7):141-152
|
|
| Y. Kim, M. Espadoto, S. Trager, J. Roerdink, A. Telea (2022) SDR-NNP: Sharpened Dimensionality Reduction with Neural Networks. In Proc. IVAPP (Best paper award)
|
|
| J. Jiao, H. Brugger, M. Behrisch, W. Eichhammer (2021) User Engagement Analysis for Smart Buildings Based on Social Trend Tracking. In European Council for an Energy Efficient Economy (ECEEEE), Summer Study Proceedings 2021, . ECEEEE
|
|
| Y. Yu, D. Kruyff, T. Becker, M. Behrisch (2021) PSEUDo: Interactive Pattern Search in Multivariate Time Series with Locality-Sensitive Hashing and Relevance Feedback
|
|
| E. Beauxis-Aussalet, M. Behrisch, R. Borgo, D.H. Chau, C. Collins, D.S. Ebert, M. El-Assady, A. Endert, D.A. Keim, J. Kohlhammer, D. Oelke, J. Peltonen, M. Riveiro, T. Schreck, H. Strobelt, J.J. van Wijk, T. Rhyne (2021) The Role of Interactive Visualization in Fostering Trust in AI
|
|
| F. Frank, M. Kaufmann, S. Kobourov, T. Mchedlidze, S. Pupyrev, T. Ueckerdt, A. Wolff (2021) Using the Metro-Map Metaphor for Drawing Hypergraphs. In SOFSEM 2021: Theory and Practice of Computer Science - 47th International Conference on Current Trends in Theory and Practice of Computer Science. Springer
|
|
| E. Arseneva, P. Cano, L. Kleist, T. Mchedlidze, S. Mehrabi, I. Parada, P. Valtr (2021) Upward Point Set Embeddings of Paths and Trees. In WALCOM: Algorithms and Computation - 15th International Conference, WALCOM 2020, Singapore, February 28 - March 2, 2020, Proceedings (S. Hong, S. Nandy, Eds.). Springer
|
|
| J. Geiger, S. Cornelsen, J. Haunert, P. Kindermann, T. Mchedlidze, M. Nöllenburg, Y. Okamoto, A. Wolff (2021) ClusterSets: Optimizing Planar Clusters in Categorical Point Data. Comput. Graph. Forum 40(3):471-481
|
|
| J.F. Buchmüller, U. Schlegel, E. Cakmak, D.A. Keim, E. Dimara (2021) SpatialRugs: A Compact Visualization of Space and Time for Analyzing Collective Movement Data. Computers & Graphics
|
|
| E. Dimara, J. Stasko (2021) A Critical Reflection on Visualization Research: Where Do Decision Making Tasks Hide? IEEE Transactions on Visualization and Computer Graphics
|
|
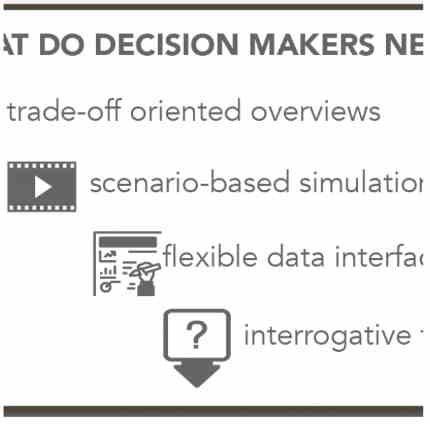
| E. Dimara, H. Zhang, M. Tory, S. Franconeri (2021) The Unmet Data Visualization Needs of Decision Makers Within Organizations. IEEE Transactions on Visualization and Computer Graphics 27:1-1
|
|
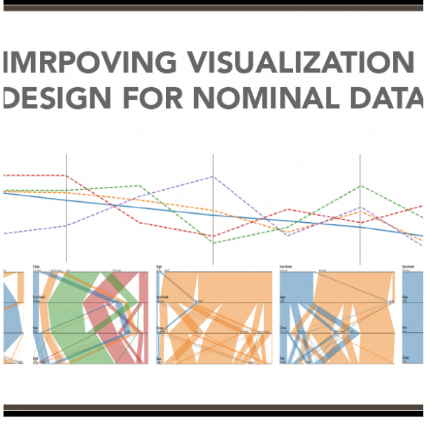
| F. Dennig, M.T. Fischer, M. Blumenschein, J. Fuchs, D.A. Keim, E. Dimara (2021) ParSetgnostics: Quality Metrics for Parallel Sets. In Eurographics Conference on Visualization (EuroVis). The Eurographics Association
|
|
| S. Liu, X. Wang, X. Ban, Y. Xu, J. Zhou, J. Kosinka, A. Telea (2021) Turbulent Details Simulation for SPH Fluids Via Vorticity Refinement. Computer Graphics Forum 40(1):54-67
|
|
| J. Wang, L. deM. Joao, A. Falcao, J. Kosinka, A. Telea (2021) Focus-and-Context Skeleton-Based Image Simplification Using Saliency Maps. In Proc. VISAPP
|
|
| T. Andry, C. Hurter, F. Lambotte, P. Fastrez, A. Telea (2021) Interpreting the Effect of Embellishment on Chart Visualizations. In Proc. ACM CHI
|
|
| X. Chen, G. Zeng, J. Kosinka, A. Telea (2021) Scalable Visual Exploration of 3D Shape Databases Via Feature Synthesis and Selection. In Communication in Computer and Information. Springer
|
|
| B. Benato, J. Gomes, A. Telea, A. Falcão (2021) Semi-supervised Deep Learning Based on Label Propagation in a 2D Embedded Space. In Proc. CIARP
|
|
| A. Telea, D. Auber (2021) Special Issue: Graph Drawing and Information Visualization. Algorithms
|
|
| A. Sobiecki, J. van Dijk, H. Folkertsma, A. Telea (2021) Does Face Restoration Improve Face Verification? Multimedia Tools and Applications 80(328):63-83
|
|
| S. Martins, A. Falcão, A. Telea (2021) Combining Registration Errors and Supervoxel Classification for Unsupervised Brain Anomaly Detection. In Communications in Computer and Information Science (1400). Springer
|
|
| J. Wang, J. Kosinka, A. Telea (2021) Spline-based Medial Axis Transform Representation of Binary Images. Computers & Graphics 98:165-176
|
|
| T. Martins, N. Lago, E. Santana, A. Telea, F. Kon, H. de Souza (2021) Using Bundling to Visualize Multivariate Urban Mobility Structure Patterns in the São Paulo Metropolitan Area. J. Internet Services and Applications 12(6)Springer
|
|
| J. Wang, J. Kosinka, A. Telea (2021) Spline-Based Dense Medial Descriptors for Lossy Image Compression. Imaging 7(8):153
|
|
| L. Merino, J.P.S. Alcocer, A. Telea (2021) Proc. IEEE VISSOFT
|
|
| J. Braz, D. Bechmann, L. Linsen, A. Telea, A. Claudio (2021) Special Issue on Computer Graphics Theory, Information Visualization Theory and Applications. Graphical Models
|
|
| A. van der Stouwe, I. Tuitert, I. Giotis, J. Calon, R. Gannamani, J. Dalenberg, S. van der Veen, M. Klamer, A. Telea, M. Tijssen (2021) The Next Move in Movement Disorders (NEMO): Developing a Computer Aided Classification Tool for Hyperkinetic Movement Disorders. BMJ Open 11(10)
|
|
| S. Martins, A. Telea, A. Falcão (2021) Unsupervised Brain Anomaly Detection in MR Images. In Proc. SIBGRAPI WTD (Best PhD thesis award)
|
|
| B.C. Benato, J.F. Gomes, A.C. Telea, A.X. Falcão (2021) Semi-Automatic Data Annotation Guided by Feature Space Projection. Pattern Recognition 109:107612 (arXiv: 2007.13689)
|
|
| Y. Wang, K. Qiu, A. Müller, Z. Hou, Z. Zhu, H. Yu (2021) Machine Learning Prediction of Quartz Forming-Environments. Journal of Geophysical Research: Solid Earth 126(8):e2021JB021925
|
|
| Z. Tian, X. Zhai, D. van Driel, G. van Steenpaal, M. Espadoto, A. Telea (2021) Using Multiple Attribute-based Explanations of Multidimensional Projections to Explore High-dimensional Data. Comput. Graph 98:93-104
|
|
| G. Appleby, M. Espadoto, R. Chen, S. Goree, A. Telea, E.W. Anderson, R. Chang (2021) HyperNP: Interactive Visual Exploration of Multidimensional Projection Hyperparameters (arXiv: 2106.13777)
|
|
| B.C. Benato, J.F. Gomes, A.C. Telea, A.X. Falcão (2021) Semi-supervised Deep Learning Based on Label Propagation in a 2D Embedded Space (arXiv:2008.00558 [cs])
|
|
| B.C. Benato, A.C. Telea, A.X. Falcão (2021) Iterative Pseudo-Labeling with Deep Feature Annotation and Confidence-Based Sampling. In Proc. SIBGRAPI, Sep
|
|
| X. Chen (2021) Analysis and Exploration of Large 3D Shape Databases. PhD thesis
|
|
| G. Hettinga (2021) Arbitrary Topology Meshes in Geometric Design and Vector Graphics. PhD thesis
|
|
| X. Chen (2021) Analysis and Exploration of Large 3D Shape Databases. PhD thesis
|
|
| M. Espadoto (2021) Learning Multidimensional Projections with Neural Networks. PhD thesis
|
|
| M. Espadoto, F. Rodrigues, N. Hirata, A. Telea (2021) OptMap: Using Dense Maps for Visualizing Multidimensional Optimization Problems. In Proc. IVAPP. SCITEPRESS, pages 123-132 (Best student paper award)
|
|
| M. Espadoto, N. Hirata, A. Telea (2021) Self-supervised Dimensionality Reduction with Neural Networks and Pseudo-labeling. In Proc. IVAPP. Setúbal, Portugal. SciTePress, pages 27-37 (Backup Publisher: INSTICCISSN: 2184-4321)
|
|
| M. Espadoto, G. Appleby, A. Suh, D. Cashman, M. Li, C.E. Scheidegger, E.W. Anderson, R. Chang, A.C. Telea (2021) UnProjection: Leveraging Inverse-Projections for Visual Analytics of High-Dimensional Data. IEEE TVCG 29(2):1559-1572
|
|
| Z. Tian, X. Zhai, G. Van Steenpaal, L. Yu, E. Dimara, M. Espadoto, A. Telea (2021) Quantitative and Qualitative Comparison of 2D and 3D Projection Techniques for High-Dimensional Data. Information 12(6):239
|
|
| E. Vernier, J. Comba, A. Telea (2021) Guided Stable Dynamic Projections. Computer Graphics Forum 40(3):87-98
|
|
| T. Mchedlidze, M. Radermacher, I. Rutter, N. Zimbel (2020) Drawing Clustered Planar Graphs on Disk Arrangements. J. Graph Algorithms Appl 24(2):105-131
|
|
| P. Angelini, M. Bekos, P. Kindermann, T. Mchedlidze (2020) On Mixed Linear Layouts of Series-Parallel Graphs. In Graph Drawing and Network Visualization - 28th International Symposium, GD 2020, Vancouver, Canada, September 16-18, 2020, Proceedings (D. Auber, P. Valtr, Eds.). Springer
|
|
| J.F. Buchmüller, U. Schlegel, E. Cakmak, D.A. Keim, E. Dimara (2020) SpatialRugs: Enhancing Spatial Awareness of Movement in Dense Pixel Visualizations. In EuroVis Workshop on Visual Analytics (EuroVA) (C. Turkay, K. Vrotsou, Eds.). The Eurographics Association
|
|
| E. Dimara, C. Perin (2020) What Is Interaction for Data Visualization? IEEE Transactions on Visualization and Computer Graphics 26(1):119-129
|
|
| R. Raissi, E. Dimara, J.H. Berry, W.D. Gray, G. Bailly (2020) Retroactive Transfer Phenomena in Alternating User Interfaces. In Proc. ACM CHI. New York, NY, USA, Apr. ACM, pages 1-14
|
|
| E. Dimara, S. Franconeri, C. Plaisant, A. Bezerianos, P. Dragicevic (2020) A Task-Based Taxonomy of Cognitive Biases for Information Visualization. IEEE Transactions on Visualization and Computer Graphics 26(2):1413-1432
|
|
| X. Chen, G. Zeng, J. Kosinka, A. Telea (2020) Visual Exploration of 3D Shape Databases Via Feature Selection. In Proc. IVAPP
|
|
| M. Espadoto, A. Falcão, N. Hirata, A. Telea (2020) Improving Neural Network-based Multidimensional Projections. In Proc. IVAPP
|
|
| S. Martins, A. Telea, A. Falcão (2020) BADRESC: Brain Anomaly Detection Based on Registration Errors and Supervoxel Classification. In Proc. BIOIMAGING (Best paper award)
|
|
| X. Zhai, X. Chen, L. Yu, A. Telea (2020) Interactive Axis-Based 3D Rotation Specification Using Image Skeletons. In Proc. GRAPP
|
|
| H. Schubert, A. Jalba, A. Telea (2020) Feature Preserving Noise Removal for Binary Voxel Volumes Using 3D Surface Skeletons. Computers & Graphics 87:32-40
|
|
| E. Vernier, M. Sondag, J. Comba, B. Speckmann, A. Telea, K. Verbeek (2020) Quantitative Comparison of Time-Dependent Treemaps. Computer Graphics Forum 39(3):393-404
|
|
| M.J. Lobo, A. Telea, C. Hurter (2020) Feature Driven Combination of Animated Vector Field Visualizations. Computer Graphics Forum 39(3):429-441
|
|
| Z. Wu, X. Chen, L. Yu, A. Telea, J. Kosinka (2020) Co-skeletons: Consistent Curve Skeletons for Shape Families. Computers & Graphics 90:62-72
|
|
| M. Espadoto, E. Vernier, A. Telea (2020) Selecting and Sharing Multidimensional Projection Algorithms: A Practical View. In Proc. VisGap. Eurographics
|
|
| D. van Driel, X. Zhai, Z. Tian, A. Telea (2020) Enhanced Attribute-Based Explanations of Multidimensional Projections. In Proc. EuroVA. Eurographics
|
|
| T. Martins, N. Lago, H. de Souza, E. Santana, A. Telea, F. Kon (2020) Visualizing the Structure of Urban Mobility with Bundling: A Case Study of the City of São Paulo. In Proc. SBRC (CoUrb Workshop) Pages 178-191 (Best paper award)
|
|
| L. Pagliosa, A. Telea, R. Mello (2020) Supporting Optimal Phase Space Reconstructions Using Neural Network Architecture for Time Series Modeling. arXiv:2006.11381 [cs.LG]
|
|
| J. Wang, M. Terpstra, J. Kosinka, A. Telea (2020) Quantitative Evaluation of Dense Skeletons for Image Compression. Information 11(5):274-290
|
|
| S. Martins, A. Telea, A. Falcão (2020) Investigating the Impact of Supervoxel Segmentation for Unsupervised Abnormal Brain Asymmetry Detection. Computerized Medical Imaging and Graphics
|
|
| S. Bouma, C. Hurter, A. Telea (2020) Structure-Aware Trail Bundling for Large DTI Datasets. Algorithms 13(12):216-241
|
|
| F.C.M. Rodrigues (2020) Visual Analytics for Machine Learning - Computing and Leveraging Decision Boundary Maps. PhD thesis
|
|
| S. Martins (2020) Unsupervised Brain Anomaly Detection in MR Images. PhD thesis
|
|
| L. Pagliosa (2020) Exploring Chaotic Time Series and Phase Spaces - From Dynamical Systems to Visual Analytics. PhD thesis
|
|
| M. Espadoto, N.S.T. Hirata, A.C. Telea (2020) Deep Learning Multidimensional Projections. Information Visualization 19(3):247-269
|
|
| E. Vernier, R. Garcia, I. da Silva, J. Comba, A. Telea (2020) Quantitative Evaluation of Time-dependent Multidimensional Projection Techniques. Computer Graphics Forum 39(3):241-252
|
|
| M. Bekos, H. Foerster, M. Gronemann, T. Mchedlidze, F. Montecchiani, C. Raftopoulou, T. Ueckerdt (2019) Planar Graphs of Bounded Degree Have Bounded Queue Number. SIAM J. Comput 48(5):1487-1502
|
|
| G. Brueckner, N.D. Krisam, T. Mchedlidze (2019) Level-Planar Drawings with Few Slopes. In Graph Drawing and Network Visualization - 27th International Symposium, GD 2019, Prague, Czech Republic, September 17-20, 2019, Proceedings (D. Archambault, C.D. Tóth, Eds.). Springer, pages 559-572
|
|
| P. Kindermann, T. Mchedlidze, T. Schneck, A. Symvonis (2019) Drawing Planar Graphs with Few Segments on a Polynomial Grid. In Graph Drawing and Network Visualization - 27th International Symposium, GD 2019, Prague, Czech Republic, September 17-20, 2019, Proceedings (D. Archambault, C.D. Tóth, Eds.). Springer, pages 416-429
|
|
| C. Binucci, G. Da Lozzo, E. Di Giacomo, W. Didimo, T. Mchedlidze, M. Patrignani (2019) Upward Book Embeddings of St-Graphs. In 35th International Symposium on Computational Geometry, SoCG 2019, June 18-21, 2019, Portland, Oregon, USA (G. Barequet, Y. Wang, Eds.). Schloss Dagstuhl - Leibniz-Zentrum für Informatik, pages 13:1-13:22
|
|
| M. A. Bekos, F. De Luca, W. Didimo, T. Mchedlidze, M. Noellenburg, A. Symvonis, I. Tollis (2019) Planar Drawings of Fixed-mobile Bigraphs. Theor. Comput. Sci 795:408-419
|
|
| P. Angelini, M. Bekos, W. Didimo, L. Grilli, P. Kindermann, T. Mchedlidze, R. Prutkin, A. Symvonis, A. Tappini (2019) Greedy Rectilinear Drawings. Theor. Comput. Sci 795:375-397
|
|
| T. Mchedlidze, A. Pak, M. Klammler (2019) Aesthetic Discrimination of Graph Layouts. J. Graph Algorithms Appl 23(3):525-552
|
|
| G. Betz, M. Hamann, T. Mchedlidze, S. von Schmettow (2019) Applying Argumentation to Structure and Visualize Multi-dimensional Opinion Spaces. Argument Comput 10(1):23-40
|
|
| N. Ruta, N. Sawada, K. McKeough, M. Behrisch, J. Beyer (2019) SAX Navigator: Time Series Exploration Through Hierarchical Clustering. In 2019 IEEE Visualization Conference, Short Papers, to appear
|
|
| M. Behrisch, T. Schreck, H. Pfister (2019) GUIRO: User-Guided Matrix Reordering. IEEE TVCG 26(1):184-194IEEE
|
|
| F. Lekschas, M. Behrisch, B. Bach, P. Kerpedjiev, N. Gehlenborg, H. Pfister (2019) Pattern-Driven Navigation in 2D Multiscale Visualizations with Scalable Insets. IEEE TVCG
|
|
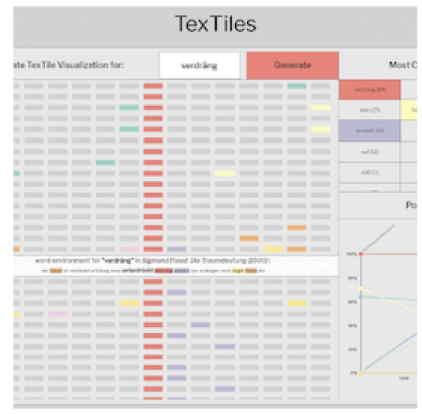
| R. Roessler, C. Kelly, M. Behrisch, J. Beyer (2019) TexTiles: Exploring Patterns in Historical Discourse. In 4th Workshop on Visualization for the Digital Humanities
|
|
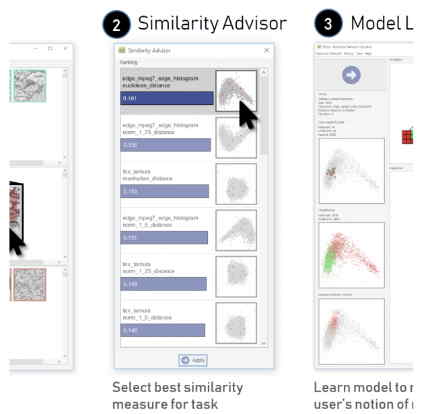
| F.L. Dennig, T. Polk, Z. Lin, T. Schreck, H. Pfister, M. Behrisch (2019) FDive: Learning Relevance Models Using Pattern-based Similarity Measures. In 14th IEEE Conference on Visual Analytics Science and Technology, IEEE VAST 2019, Vancouver, BC, Canada, October 20-25, 2019 (R. Chang, D.A. Keim, R. Maciejewski, Eds.). IEEE, pages 69-80
|
|
| E. Dimara, G. Bailly, A. Bezerianos, S. Franconeri (2019) Mitigating the Attraction Effect with Visualizations. IEEE Transactions on Visualization and Computer Graphics 25(1):850-860
|
|
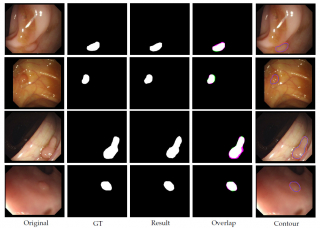
| W. Dijkstra, A. Sobiecki, J.B. del Nozal, A. Telea (2019) Towards a Single Solution for Polyp Detection, Localization, and Segmentation in Colonoscopy Images. In Proc. GIANA
|
|
| J. Matute, M. Fischer, A. Telea, L. Linsen (2019) Scatterplot Summarization by Constructing Fast and Robust Principal Graphs From Skeletons. In Proc. IEEE PacificVis
|
|
| A. Telea, T. Theoharis (2019) Special Section on 3D Object Retrieval (3DOR 2018) Computers & Graphics
|
|
| D. Bechmann, M. Chesa, A.P. Claudio, F. Imai, A. Kerren, P. Richard, A. Telea, A. Tremeau (2019) Computer Vision, Imaging and Computer Graphics - Theory and Applications (Revised Selected Papers From VISIGRAPP 2018)
|
|
| A. Claudio, D. Bechmann, P. Richard, T. Yamaguchi, L. Linsen, A. Telea, F. Imai, A. Tremeau (2019) Computer Vision, Imaging and Computer Graphics - Theory and Applications (Revised Selected Papers From VISIGRAPP 2017)
|
|
| R. Garcia, A. Falcão, A. Telea, B. da Silva, J. Torresen, J. Comba (2019) A Methodology for Neural Network Architectural Tuning Using Activation Occurrence Maps. In Proc. IJCNN
|
|
| W. Zeng, Q. Shen, Y. Jiang, A. Telea (2019) Route-Aware Edge Bundling for Visualizing Origin-Destination Trails in Urban Traffic. Computer Graphics Forum 38(3):581-593
|
|
| M. Espadoto, F.C.M. Rodrigues, N. Hirata, R. Hirata Jr, A. Telea (2019) Deep Learning Inverse Multidimensional Projections. In Proc. EuroVA
|
|
| S.B. Martins, A. Telea, A.X. Falcão (2019) Extending Supervoxel-based Abnormal Brain Asymmetry Detection to the Native Image Space. In Proc. IEEE Conf. Engineering in Medicine and Biology (EMBC)
|
|
| L. Pagliosa, A. Telea (2019) RadViz++: Improvements on Radial-Based Visualizations. Informatics 6(16):1-23
|
|
| M. Espadoto, N. Hirata, A. Telea (2019) Deep Learning Multidimensional Projections. arXiv: 1902.07958 [cs.LG]
|
|
| E. Vernier, M. Sondag, J. Comba, B. Speckmann, A. Telea, K. Verbeek (2019) Quantitative Comparison of Time-Dependent Treemaps. arXiv: 1906.06014 [cs.CG]
|
|
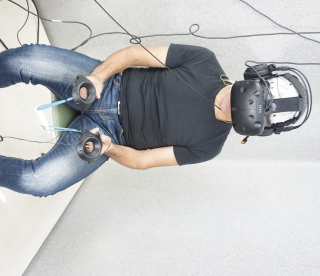
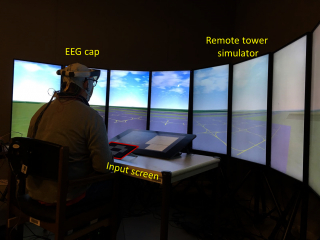
| P. Arico, M. Reynal, G.D. Fiumeri, G. Borghini, N. Sciaraffa, J. Imbert, C. Hurter, M. Terenzi, A. Ferreira, S. Pozzi, V. Betti, M. Marucci, A. Telea, F. Babiloni (2019) How Neurophysiological Measures Can Be Used to Enhance the Evaluation of Remote Tower Solutions. Front. Hum. Neurosci 13(303)
|
|
| Y. Kim, S. Trager, A. Telea, J. Roerdink (2019) Visualizing High-dimensional Chemical Abundance Space in GALAH DR2. In Proc. ADASS'19 (poster)
|
|
| M. Espadoto, R. Martins, A. Kerren, N. Hirata, A. Telea (2019) Toward a Quantitative Survey of Dimension Reduction Techniques. IEEE TVCG 27(3):2153-2173
|
|
| M. Espadoto, F.C.M. Rodrigues, A. Telea (2019) Visual Analytics of Multidimensional Projections for Constructing Classifier Decision Boundary Maps. In Proc. IVAPP. SCITEPRESS (Best paper award)
|
|
| F.C.M. Rodrigues, M. Espadoto, R. Hirata, A.C. Telea (2019) Constructing and Visualizing High-Quality Classifier Decision Boundary Maps. Information 10(9):280-297
|
|
| M. Behrisch, M. Blumenschein, N.W. Kim, L. Shao, M. El-Assady, J. Fuchs, D. Seebacher, A. Diehl, U. Brandes, H. Pfister, T. Schreck, D. Weiskopf, D.A. Keim (2018) Quality Metrics for Information Visualization. Comput. Graph. Forum 37(3):625-662
|
|
| M. Behrisch, R. Krüger, F. Lekschas, T. Schreck, N. Gehlenborg, H. Pfister (2018) Visual Pattern-Driven Exploration of Big Data. In IEEE Symposium on Big Data Visual Analytics, Oct, pages 1-10
|
|
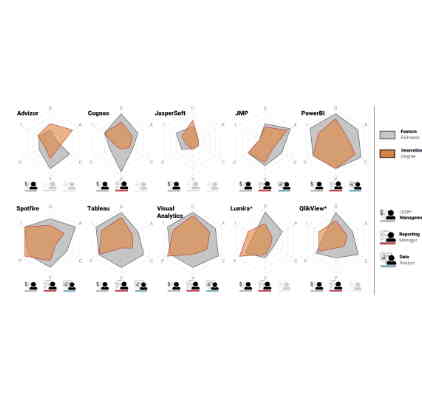
| M. Behrisch, D. Streeb, F. Stoffel, D. Seebacher, B. Matejek, S.H. Weber, S. Mittelstaedt, H. Pfister, D. Keim (2018) Commercial Visual Analytics Systems-Advances in the Big Data Analytics Field. IEEE Transactions on Visualization and Computer Graphics
|
|
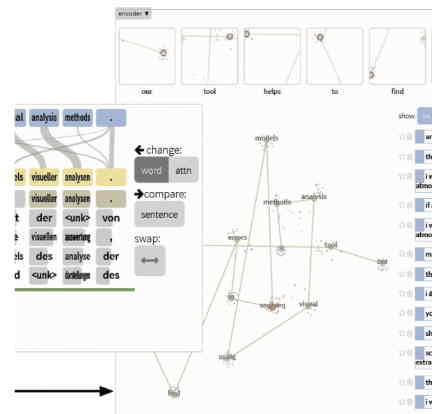
| H. Strobelt, S. Gehrmann, M. Behrisch, A. Perer, H. Pfister, A.~M Rush (2018) Seq2Seq-Vis: A Visual Debugging Tool for Sequence-to-Sequence Models. ArXiv E-prints
|
|
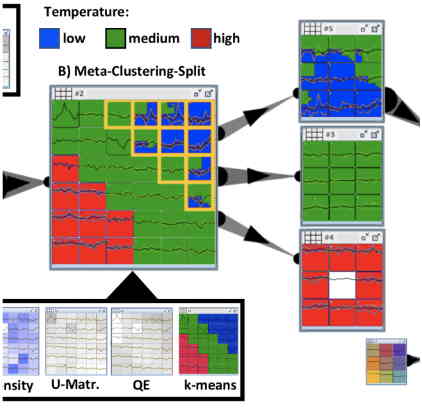
| D. Sacha, M. Kraus, J. Bernard, M. Behrisch, T. Schreck, Y. Asano, D.A. Keim (2018) SOMFlow: Guided Exploratory Cluster Analysis with Self-Organizing Maps and Analytic Provenance. IEEE Trans. Vis. Comput. Graph 24(1):120-130
|
|
| E. Dimara, A. Bezerianos, P. Dragicevic (2018) Conceptual and Methodological Issues in Evaluating Multidimensional Visualizations for Decision Support. IEEE Transactions on Visualization and Computer Graphics 24(1):749-759IEEE
|
|
| A. Telea, A. Kerren (2018) Special Issue on IVAPP 2018 Selected Papers. Informatics 9(7)
|
|
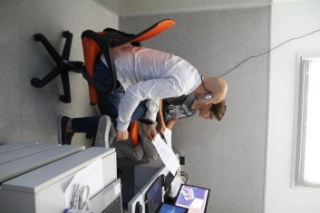
| R.D. Piano, A. Ferreira, S. Pozzi, M. Terenzi, V. Betti, E. Pavone, M. Marucci, P. Arico, G. Borghini, G.D. Flumeri, N. Sciaraffa, F. Babiloni, S. Aglioti, C. Hurter, R. Benhacene, C. Clercq, M. Reynal, A. Telea, J. Kruiger (2018) Virtual Reality Platform To Assess Air Traffic Controllers Performance In Control Tower Operations. In Proc. VSMM (posters)
|
|
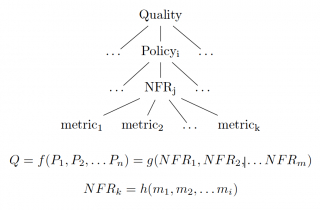
| L. Borodaev, R. Smedinga, A. Telea, R. Groenboom (2018) Software Metrics for Policy-driven Software Development Life Cycle Automation. In Proc. IEEE Intl. Conf. on Software Testing, Verification and Validation Workshops (ICSTW) Pages 169-174
|
|
| A. Telea (2018) Data Visualization Methods. In SAGE Encyclopedia of Educational Research, Measurement, and Evaluation. (B. Frey, Eds.), SAGE Publ, pages 461-464
|
|
| A. Telea, T. Theoharis (2018) Proc. 3DOR
|
|
| P. Arico, M. Reynal, J. Imbert, C. Hurter, G. Borghini, G.D. Flumeri, N. Sciaraffa, A.D. Florio, M. Terenzi, A. Ferreira, S. Pozzi, V. Betti, M. Marucci, E. Pavone, A. Telea, F. Babiloni (2018) Human-Machine Interaction Assessment by Neurophysiological Measures: A Study on Professional Air Traffic Controllers. In Proc. IEEE Conf. Engineering in Medicine and Biology (EMBC)
|
|
| M. Staron, H. Sahraoui, A. Telea (2018) Special Section on Visual Analytics in Software Engineering. Information and Software Technology 98:117
|
|
| J. Kustra, A. Telea (2018) Visual Analytics for Classifier Construction and Evaluation for Medical Data. In Data Science for Healthcare. Springer
|
|
| M. Traoré, C. Hurter, A. Telea (2018) Interactive Obstruction-free Lensing for Volumetric Data Visualization. IEEE TVCG 25(1)
|
|
| E. Vernier, J. Comba, A. Telea (2018) A Stable Greedy Insertion Treemap Algorithm for Software Evolution Visualization. In Proc. SIBGRAPI
|
|
| E. Vernier, J. Comba, A. Telea (2018) Quantitative Comparison of Dynamic Treemaps for Software Evolution Visualization. In Proc. IEEE VISSOFT (Distinguished paper award)
|
|
| D. Coimbra, T. Neves, A. Telea, F. Paulovich (2018) The Shape of the Game. In Proc. SIBGRAPI
|
|
| A. Telea (2018) Image-Based Graph Visualization: Advances and Challenges. In Proc. Graph Drawing (Keynote paper)
|
|
| F.C.M. Rodrigues, R. Hirata, A.C. Telea (2018) Image-based Visualization of Classifier Decision Boundaries. In Proc. SIBGRAPI. IEEE, pages 353-360
|
|
| B.C. Benato, A.C. Telea, A.X. Falcão (2018) Semi-Supervised Learning with Interactive Label Propagation Guided by Feature Space Projections. In Proc. SIBGRAPI. IEEE, pages 392-399
|
|
| M. van der Zwan (2018) Visual Analytics of Multidimensional Time-Dependent Trails with Applications in Shape Tracking. PhD thesis
|
|
| R. Garcia, A. Telea, B. da Silva, J. Torresen, J. Comba (2018) A Task-and-technique Centered Survey on Visual Analytics for Deep Learning Model Engineering. Computers and Graphics 77:30-49
|
|
| E. Dimara, A. Bezerianos, P. Dragicevic (2017) Narratives in Crowdsourced Evaluation of Visualizations: A Double-Edged Sword? In Proc. ACM CHI. New York, NY, USA, May. ACM, pages 5475-5484
|
|
| E. Dimara, P. Valdivia, C. Kinkeldey (2017) DCPAIRS: A Pairs Plot Based Decision Support System. In EuroVis Workshop
|
|
| E. Dimara, A. Bezerianos, P. Dragicevic (2017) The Attraction Effect in Information Visualization. IEEE TVCG 23(1):471-480IEEE (Best paper honorable mention)
|
|
| C. Hurter, S. Puechmorel, F. Nicol, A. Telea (2017) Functional Decomposition for Bundled Simplification of Trail Sets. IEEE TVCG 24(1):500-510
|
|
| P.E. Rauber, A.X. Falcão, A.C. Telea (2017) Projections as Visual Aids for Classification System Design. Information Visualization 17(4):282-305SAGE Publ
|
|
| J. Kruiger, A. Telea, C. Hurter (2017) Projection Navigation In Extremely Large Datasets (PNIELD) In Proc. EuroVis - Posters
|
|
| R. Martins, J. Kruiger, R. Minghim, A. Telea, A. Kerren (2017) MVN-Reduce: Dimensionality Reduction for the Visual Analysis of Multivariate Networks. In Proc. EuroVis - Short Papers
|
|
| J. Braz, A. Claudio, P. Richard, T. Yamaguchi, L. Linsen, A. Telea, F. Imai, A. Tremeau (2017) Proc. VISIGRAPP SCITEPRESS
|
|
| A. Lhuillier, C. Hurter, A. Telea (2017) FFTEB: Edge Bundling of Huge Graphs by the Fast Fourier Transform. In Proc. IEEE PacificVis
|
|
| A. Lhuillier, C. Hurter, A. Telea (2017) State of the Art in Edge and Trail Bundling Techniques. Computer Graphics Forum 36(3):619-645
|
|
| J. Bennett, A. Telea (2017) Proc. EGPGV Eurographics
|
|
| E. Vernier, J. Comba, A. Telea (2017) Quantitative Comparison of Treemap Techniques for Time-Dependent Hierarchies. In Proc. EuroVis - Posters (Best poster award)
|
|
| A. Falcão, C. Feng, J. Kustra, A. Telea (2017) Multiscale 2D Medial Axes and 3D Surface Skeletons by the Image Foresting Transform. In Skeletonization - Theory, Methods, and Applications. (P. Saha, G. Borgefors, G.S. di Baja, Eds.), Elsevier
|
|
| J. Koehoorn, C. Feng, J. Kustra, A. Jalba, A. Telea (2017) Unified Part-patch Segmentation of Mesh Shapes Using Surface Skeletons. In Skeletonization - Theory, Methods, and Applications. (P. Saha, G. Borgefors, G.S. di Baja, Eds.), Elsevier
|
|
| J. Kruiger, A. Hassoumi, H.J. Schulz, A. Telea, C. Hurter (2017) Multidimensional Data Exploration by Explicitly Controlled Animation. Informatics 4(3):26
|
|
| J.A.M. Flores, L. Linsen, A. Telea (2017) Skeleton-based Scagnostics. IEEE TVCG 24(1):542-552
|
|
| A. Telea, A. Kerren, J. Braz (2017) Proc. $13^{th}$ International Joint Conference on Computer Vision, Imaging and Computer Graphics Theory and Applications SCITEPRESS
|
|
| J. Braz, N. Magnenat-Thalmann, P. Richard, L. Linsen, A. Telea, S. Battiato, F. Imai (2017) Computer Vision, Imaging and Computer Graphics Theory and Applications - VISIGRAPP 2016 Revised Selected Papers Springer
|
|
| S. van Vliet, A. Sobiecki, A. Telea (2017) Joint Brightness and Tone Stabilization of Capsule Endoscopy Videos. In Proc. IVAPP
|
|
| A. Telea (2017) Image-based Information Visualization (or How to Unify SciVis and InfoVis) In Proc. WSCG (Keynote paper)
|
|
| J.F. Kruiger, P.E. Rauber, R.M. Martins, A. Kerren, S. Kobourov, A.C. Telea (2017) Graph Layouts by T-SNE. Computer Graphics Forum 36(3):283-294
|
|
| C. Feng (2017) Shape Segmentation and Retrieval Based on the Skeleton Cut Space. PhD thesis
|
|
| P. Rauber (2017) Visual Analytics Applied to Image Analysis: From Segmentation to Classification. PhD thesis (ISBN: 978-90-367-9288-2)
|
|
| P. Rauber, S.G. Fadel, A. Falcão, A. Telea (2017) Visualizing the Hidden Activity of Artificial Neural Networks. IEEE TVCG 23(1):101-110
|
|
| J. Roerdink, K.L. Ma, G. Santucci, J. van Wijk, R. Maciejewski, T. Ropinski, A. Vilanova, E. Bertini, N. Elmqvist, F. Sadlo, A. Telea (2016) Proc. EuroVis Eurographics
|
|
| J. Braz, N. Magnenat-Thalmann, P. Richard, L. Linsen, A. Telea, S. Battiato, F. Imai (2016) Prov. VISIGRAPP SCITEPRESS
|
|
| J. Koehoorn, A. Sobiecki, P. Rauber, A. Jalba, A. Telea (2016) Efficient and Effective Automated Digital Hair Removal From Dermoscopy Images. Math. Morphol. Theory Appl 1De Gruyter
|
|
| C. Feng, A. Jalba, A. Telea (2016) Improved Part-Based Segmentation of Voxel Shapes by Skeleton Cut Spaces. Math. Morphol. Theory Appl 1De Gruyter
|
|
| A. Sobiecki, A. Jalba, A. Telea (2016) Robust Gap Removal From Binary Volumes. In Proc. Eurographics (short Papers)
|
|
| P. Rauber, A. Falcao, A. Telea (2016) Visualizing Time-dependent Data Using Dynamic T-SNE. In Proc. EuroVis - Short Papers, pages 43-49 (Honorable mention paper award)
|
|
| A. Tagliasacchi, T. Delame, M. Spagnuolo, N. Amenta, A. Telea (2016) 3D Skeletons: A State-of-the-Art Report. Computer Graphics Forum 35(2):573-597
|
|
| C. Feng, A. Jalba, A. Telea (2016) A Descriptor for Voxel Shapes Based on the Skeleton Cut Space. In Proc. 3DOR. Eurographics
|
|
| R. da Silva, P. Rauber, R. Martins, R. Minghim, A. Telea (2016) Exploring Multidimensional Projections Through Explanatory Maps. In Proc. ICT-OPEN
|
|
| T. Delame, J. Kustra, A. Telea (2016) Structuring 3D Medial Skeletons: A Comparative Study. In Proc. Vision Modeling Visualization (VMV). Eurographics
|
|
| R. da Silva, E. Vernier, P. Rauber, J. Comba, R. Minghim, A. Telea (2016) Metric Evolution Maps: Multidimensional Attribute-driven Exploration of Software Repositories. In Proc. Vision Modeling Visualization (VMV). Eurographics
|
|
| R. da Silva, P. Rauber, A. Telea (2016) Beyond the Third Dimension: Visualizing High-dimensional Data with Projections. IEEE Computing in Science & Engineering 18(5):98-107
|
|
| R.M. Martins (2016) Explanatory Visualization of Multidimensional Projections. PhD thesis
|
|
| D.B. Coimbra (2016) Multidimensional Projections for the Visual Exploration of Multimedia Data. PhD thesis
|
|
| R.R. da Silva (2016) Visualizing Multidimensional Data Similarities - Improvements and Applications. PhD thesis
|
|
| A. Sobiecki (2016) Skeletonization Methods for Image and Volume Inpainting. PhD thesis
|
|
| D.B. Coimbra, R.M. Martins, T.T. Neves, A.C. Telea, F.V. Paulovich (2016) Explaining Three-dimensional Dimensionality Reduction Plots. Information Visualization 15(2):154-172SAGE Publ
|
|
| M. van der Zwan, V. Codreanu, A. Telea (2016) CUBu: Universal Real-time Bundling for Large Graphs. IEEE TVCG 22(12):2550-2563
|
|
| N. Boukhelifa, E. Giannisakis, E. Dimara, W. Willett, J. Fekete, E. Bertini, J.C. Roberts (2015) Supporting Historical Research Through User-Centered Visual Analytics. In EuroVis Workshop on Visual Analytics (EuroVA) (E.B. Roberts, J. C, Eds.). The Eurographics Association
|
|
| W. Schmidt, J. Sotomayor, A. Telea, C. Silva, J. Comba (2015) A 3D Shape Descriptor Based on Depth Complexity and Thickness Histograms. In Proc. SIBGRAPI
|
|
| V. Peysakhovich, C. Hurter, A. Telea (2015) Attribute-Driven Edge Bundling for General Graphs with Applications in Trail Analysis. In Proc. IEEE PacificVis
|
|
| A. Sobiecki, J. Koehoorn, D. Boda, C. Solovan, A. Diaconeasa, A. Jalba, A. Telea (2015) A New Efficient Method for Digital Hair Removal by Dense Threshold Analysis. In Proc. 4th World Congress of Dermoscopy
|
|
| M. van der Zwan, A. Telea (2015) Robust and Fast Teat Detection and Tracking in Low-Resolution Videos for Automatic Milking Devices. In Proc. VISAPP
|
|
| J. Kustra, A. Jalba, A. Telea (2015) Computing Refined Skeletal Features From Medial Point Clouds. Pattern Recognition Letters 76(C):13-21
|
|
| P. Rauber, R. da Silva, S. Feringa, M. Celebi, A. Falcão, A. Telea (2015) Interactive Image Feature Selection Aided by Dimensionality Reduction. In Proc. EuroVA
|
|
| A. Jalba, A. Sobiecki, A. Telea (2015) An Unified Multiscale Framework for Planar, Surface, and Curve Skeletonization. IEEE TPAMI 38(1):38-55
|
|
| C. Feng, A. Jalba, A. Telea (2015) Part-Based Segmentation by Skeleton Cut Space Analysis. In Proc. ISMM
|
|
| J. Koehoorn, A. Sobiecki, D. Boda, A. Diaconeasa, S. Doshi, S. Paisey, A. Jalba, A. Telea (2015) Automated Digital Hair Removal by Threshold Decomposition and Morphological Analysis. In Proc. ISMM
|
|
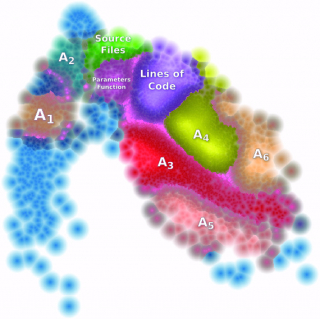
| R. Martins, R. Minghim, A.C. Telea (2015) Explaining Neighborhood Preservation for Multidimensional Projections. In Proc. CGVC. Eurographics, pages 121-128 (Best paper award)
|
|
| J. Kustra (2015) Medial Descriptors for 3D Shape Segmentation, Reconstruction, and Analysis. PhD thesis
|
|
| R. da Silva, P. Rauber, R. Martins, R. Minghim, A.C. Telea (2015) Attribute-based Visual Explanation of Multidimensional Projections. In Proc. EuroVA
|
|
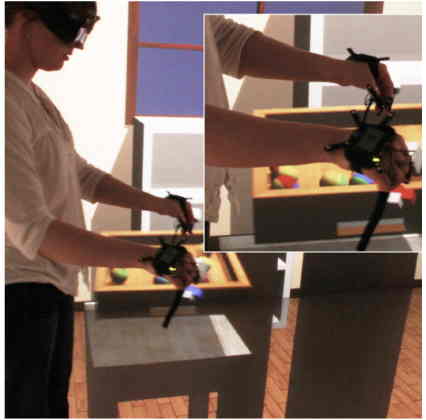
| E. Chapoulie, M. Marchal, E. Dimara, M. Roussou, J. Lombardo, G. Drettakis (2014) Evaluation of Direct Manipulation Using Finger Tracking for Complex Tasks in an Immersive Cube. Virtual Reality 18(3):203-217
|
|
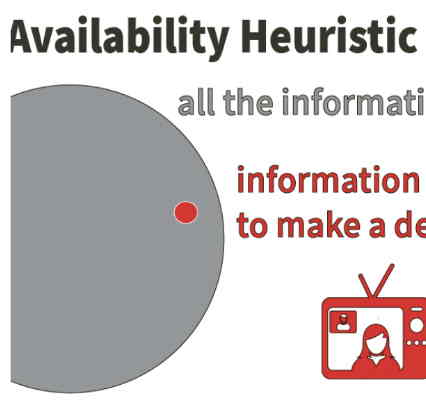
| E. Dimara, P. Dragicevic, A. Bezerianos (2014) Accounting for Availability Biases in Information Visualization. In IEEE VIS 2014 DECISIVe: Workshop on Dealing with Cognitive Biases in Visualizations
|
|
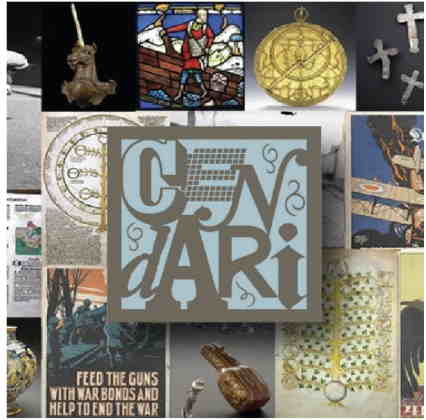
| J. Benes, A. O'Connor, E. Dimara (2014) The CENDARI Project: A User-centered 'enquiry Environment' for Modern and Medieval Historians. In Digital Humanities - Posters, pages 434-436
|
|
| C. Hurter, A. Taylor, S. Carpendale, A. Telea (2014) Color Tunneling: Interactive Exploration and Selection in Volumetric Datasets. In Proc. IEEE PacificVis
|
|
| T. Klein, M. van der Zwan, A. Telea (2014) Dynamic Multiscale Visualization of Flight Data. In Proc. VISAPP
|
|
| J. Kustra, A. Jalba, A. Telea (2014) Shape Segmentation Using Medial Point Clouds with Applications to Dental Cast Analysis. In Proc. VISAPP
|
|
| J. Kustra, M. de Jager, A. Jalba, A. Telea (2014) A Medial Point Cloud Based Algorithm for Dental Cast Segmentation. In Proc. IEEE ICCE
|
|
| J. Kustra, M. de Jager, A. Jalba, A. Telea (2014) Teeth Shape Modeling Pipeline for Oral Healthcare Appliances Development. In Proc. IEEE ICCE
|
|
| R. Martins, D. Coimbra, R. Minghim, A.C. Telea (2014) Visual Analysis of Dimensionality Reduction Quality for Parameterized Projections. Computers & Graphics
|
|
| C. Hurter, S. Conversy, D. Gianazza, A. Telea (2014) Interactive Image-based Information Visualization for Aircraft Trajectory Analysis. Transportation Research C
|
|
| B. Liu, A. Telea, J. Roerdink, G. Clapworthy, D. Williams, P. Yang, F. Dong, V. Codreanu, A. Chiarini (2014) Parallel Centerline Extraction on the GPU. Computers & Graphics
|
|
| D. Archambault, J. Abello, J. Kennedy, S. Kobourov, K.-L. Ma, S. Miksch, C. Muelder, A. Telea (2014) Temporal Multivariate Networks. In Multivariate Network Visualization (Proc. Dagstuhl Seminar 13201)., Springer LNCS 8380, pages 151-173
|
|
| S. Diehl, A. Telea (2014) Multivariate Networks in Software Engineering. In Multivariate Network Visualization (Proc. Dagstuhl Seminar 13201)., Springer LNCS 8380, pages 13-16
|
|
| A. Sobiecki, A. Jalba, A. Telea (2014) Comparison of Curve and Surface Skeletonization Methods for Voxel Shapes. Pattern Recognition Letters 47:47-56
|
|
| C. Hurter, A. Taylor, S. Carpendale, A. Telea (2014) Interactive Exploration and Selection in Volumetric Datasets with Color Tunneling. In Proc. UIST Demos
|
|
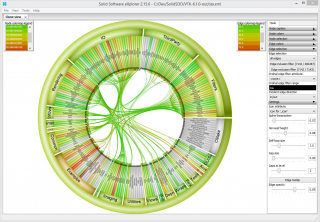
| L. Voinea, A. Telea (2014) Visual Clone Analysis with SolidSDD. In Proc. IEEE VISSOFT
|
|
| L. Voinea, A. Telea (2014) Visual Clone Analysis with SolidSDD. In Proc. IEEE VISSOFT (poster)
|
|
| A. Sobiecki, A. Jalba, D. Boda, A. Diaconeasa, A. Telea (2014) Gap-Sensitive Segmentation and Restoration of Digital Images. In Proc. CGVC
|
|
| A.C. Telea (2014) Data Visualization: Principles and Practice CRC Press, Boca Raton
|
|
| B. Broeksema (2014) The Decision Exploration Lab - Supporting the Business Analyst in Understanding Automated Decisions. PhD thesis
|
|
| J. Kustra, A. Jalba, A. Telea (2013) Probabilistic View-based Curve Skeleton Computation on the GPU. In Proc. VISAPP
|
|
| D. Boda, A. Diaconeasa, S. Zurac, A. Telea, M. Neagu, C. Constantin, C. Solovan, R. Voinescu (2013) Automatic Segmentation of Skin Lesions Using Multiscale Skeletons. In Proc. 8th EADO Congress
|
|
| A. Jalba, J. Kustra, A. Telea (2013) Surface and Curve Skeletons From Large Meshes on the GPU. IEEE TPAMI 35(6):1495-1508
|
|
| D. Boda, A. Diaconeasa, M. Neagu, C. Solovan, A. Telea, R. Voinescu, S. Zurac (2013) Qualitative Comparison of Multiscale Skin Tumor Segmentation Methods. In Proc. 4th Intl. Conf. of the Romanian Society of Dermato-Oncology
|
|
| A. Sobiecki, H. Yasan, A. Jalba, A. Telea (2013) Qualitative Comparison of Contraction-based Curve Skeletonization Methods. In Proc. ISMM
|
|
| A. Telea, C. Goerg, S. Reiss (2013) Introduction to the Special Issue of Selected Papers From ACM SOFTVIS 2010. Information Visualization
|
|
| C. Hurter, O. Ersoy, A. Telea (2013) Smooth Bundling of Large Streaming and Sequence Graphs. In Proc. IEEE PacificVis (Honorable Mention Paper Award)
|
|
| A. Sobiecki, L.A. Neves, A. Telea, C.E. Thomaz, G. Giraldi (2013) Low-Cost Automatic Inpainting for Artifact Suppression in Facial Images. In Proc. VISAPP
|
|
| M. van der Zwan, Y. Meiburg, A. Telea (2013) A Dense Medial Descriptor for Image Analysis. In Proc. VISAPP
|
|
| J. Kustra, A. Jalba, A. Telea (2013) Robust Segmentation of Multiple Manifolds From Unoriented Noisy Point Clouds
|
|
| B. Broeksema, T. Baudel, A. Telea, P. Crisafulli (2013) Decision Exploration Lab: A Visual Analytics Solution for Decision Management. IEEE TVCG 19(2):1972-1981
|
|
| B. Broeksema, T. Baudel, A. Telea (2013) Visual Analysis of Multidimensional Categorical Datasets. Computer Graphics Forum 32(8):158-169
|
|
| J. Trümper, J. Döllner, A. Telea (2013) Multiscale Visual Comparison of Execution Traces. In Proc. ICPC
|
|
| A. Marcus, A. Kerren, A. Telea (2013) Proc. IEEE VISSOFT
|
|
| M. van der Zwan, A. Telea (2013) Teat Detection - Low Resolution Robust Shape Tracking. In Proc. ICT.OPEN (poster)
|
|
| A. Sobiecki, A. Jalba, A. Telea (2013) Qualitative and Quantitative Comparison of Curve and Surface Skeletons - A State of the Art Review. In Proc. ICT.OPEN (poster)
|
|
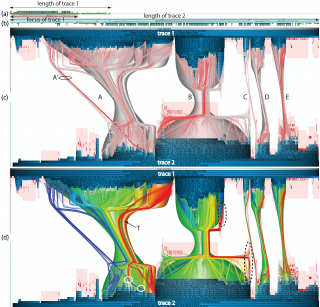
| C. Hurter, O. Ersoy, S. Fabrikant, T. Klein, A. Telea (2013) Bundled Visualization of Dynamic Graph and Trail Data. IEEE TVCG 20(8):1141-1157
|
|
| (2013) Image Based Graph Visualization. PhD thesis
|
|
| A. Telea, H. Byelas, L. Voinea (2008) A Framework for Reverse Engineering Large C++ Code Bases. Electronic Notes in Theoretical Computer Science
|
|
| H. Byelas, A. Telea (2008) Evaluating Visual Realism in Drawing Areas of Interest on UML Diagrams. In Proc. ASCI
|
|
| V. Valeanu, A. Telea, M. Marin, P. de Hillerin, A. Vizitiu (2008) Automatic Warning for Abnormal Vital Parameters Evolution in Tele- and Home-Care Applications. In Proc. SpaceAppli
|
|
| D. Reniers, A. Telea (2008) Hierarchical Part-type Segmentation Using Voxel-based Curve Skeletons. Visual Computer 24(383)
|
|
| A. Telea, L. Voinea (2008) A Tool for Optimizing the Build Performance of Large Software Code Bases. In Proc. IEEE CSMR
|
|
| A. Telea, L. Voinea (2008) SolidFX: An Interactive Reverse Engineering Environment for C++ In Proc. IEEE CSMR
|
|
| H. Byelas, A. Telea (2008) Towards Visual Realism in Drawing Areas of Interest on Software Architecture Diagrams. J. Vis Lang Comput 20(2):110-128
|
|
| L. Voinea, A. Telea (2008) Visual Querying and Analysis of Large Software Repositories. Empirical Software Engineering 14(3):316-340
|
|
| D. Reniers, A. Telea (2008) Segmented Simplified Surface Skeletons. In Proc. DGCI
|
|
| D. Reniers, A. Telea (2008) Part-type Segmentation of Articulated Voxel-Shapes Using the Junction Rule. Computer Graphics Forum 27(7)
|
|
| R. Koschke, A. Telea, C. Hundhausen (2008) Proc. ACM SOFTVIS (cover image on .../SoftVis08/cover.pdf conference proceedings)
|
|
| H. Byelas, A. Telea (2008) Texture-Based Visualization of Metrics on Software Architectures. In Proc. ACM SoftVis (posters)
|
|
| M. Sensalire, P. Ogao, A. Telea (2008) Classifying Desirable Features of Software Visualization Tools for Corrective Maintenance. In Proc. ACM SoftVis
|
|
| A. Telea, L. Voinea (2008) An Interactive Reverse-Engineering Environment for Large-Scale C++ Code. In Proc. ACM SoftVis
|
|
| A. Vilanova, A. Telea, G. Scheuermann, T. Möller (2008) Proc. EuroVis. Computer Graphics Forum 27(3)
|
|
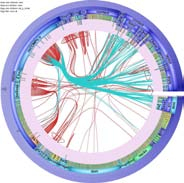
| A. Telea, D. Auber (2008) Code Flows: Visualizing Structural Evolution of Source Code. Computer Graphics Forum 27(3):831-838
|
|
| A. Telea (2008) Data Visualization: Principles and Practice A. K. Peters / CRC Press
|
|
| D. Reniers, A. Telea (2008) Robust Segmentation of Voxel Shapes Using Medial Surfaces. In Proc. Shape Modeling and Applications, pages 273-274
|
|
| A. Telea, L. Voinea (2008) Visual Analytics for Understanding the Evolution of Large Software Projects. In Proc. BENEVOL, pages 24-27
|
|
| A. Telea, H. Byelas, L. Voinea (2008) Architecting an Open System for Querying Large C and C++ Code Bases. South African J. Comp
|
|
| H. Byelas, A. Telea (2008) Visual Software Analytics for Assessing the Maintainability of Object-Oriented Software Systems. J. Information, Interaction, and Intelligence 8(1)
|
|
| D. Reniers, A. Jalba, A. Telea (2008) Robust Classification and Analysis of Anatomical Surfaces Using 3D Skeletons. In Proc. VCBM
|
|
| H. Byelas, A. Telea (2008) The Metric Lens: Visualizing Metrics and Structure on Software Diagrams. In Proc. WCRE (tool Demos)
|
|
| D. Reniers, A. Telea (2008) Patch-type Segmentation of Voxel Shapes Using Simplified Surface Skeletons. Computer Graphics Forum 27(7):1837-1844
|
|
| F. Chevalier, D. Auber, A. Telea (2007) Structural Analysis and Visualization of C++ Code Evolution Using Syntax Trees. In Proc. IWPSE. ACM
|
|
| A. Marcus, J. Maletic, A. Telea (2007) Proc. VISSOFT IEEE (MS Word source .../VisSoft07/FrontMat.doc)
|
|
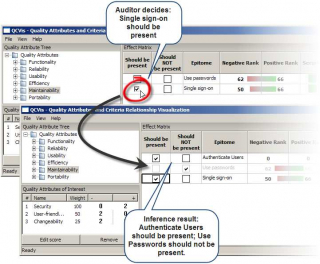
| H. Byelas, A. Telea (2007) Visualization of Quality Attributes on Software Architectures. In Proc. SIREN (TU Delft)
|
|
| A. Telea, P. de Hillerin, V. Valeanu (2007) Visualization of Multivariate Athlete Performance Data. In Proc. VIIP
|
|
| S. Roubtsov, A. Telea, D. Holten (2007) SQuAVisiT: A Software Quality Assessment and Visualisation Toolset. In Proc. IEEE SCAM (tool Demos)
|
|
| S. Moreta, A. Telea (2007) Visualizing Dynamic Memory Allocations. In Proc. IEEE VISSOFT
|
|
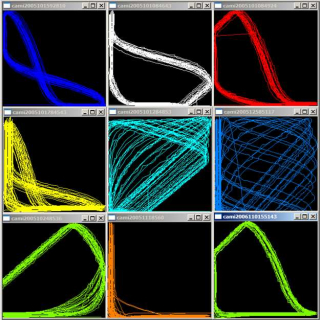
| L. Voinea, A. Telea (2007) Visualizing Debugging Activity in Source Code Repositories. In Proc. IEEE VISSOFT
|
|
| D. Reniers, A. Telea (2007) Skeleton-based Hierarchical Shape Segmentation. In Proc. Shape Modeling and Applications. IEEE
|
|
| S. Moreta, A. Telea (2007) Multiscale Visualization of Dynamic Software Logs. In Proc. EuroVis
|
|
| T. Preusser, M. Droske, C. Garbe, A. Telea, M. Rumpf (2007) A Phase Field Method for Joint Denoising, Edge Detection and Motion Estimation. SIAM J Applied Math 68(3):599-618
|
|
| K. van Kooten, G. van den Bergen, A. Telea (2007) Point-Based Visualization of Metaballs on a GPU. In GPU Gems 3. (H. Nguyen, Eds.), Addison-Wesley
|
|
| D. Reniers, A. Telea (2007) Tolerance-Based Feature Transforms. In Comm. in Computer and Information Science. Springer, pages 187-200
|
|
| D. Reniers, J. van Wijk, A. Telea (2007) Computing Multiscale Curve and Surface Skeletons of Genus 0 Shapes Using a Global Importance Measure. IEEE TVCG 14(2):355-368
|
|
| L. Voinea (2007) Software Evolution Visualization. PhD thesis
|
|
| M. van Eede, D. Macrini, A. Telea, C. Sminchisescu, S. Dickinson (2006) Canonical Skeletons for Shape Matching. In Proc. ICPR. IEEE
|
|
| A. Telea, T. Preusser, C. Garbe, M. Droske, M. Rumpf (2006) A Variational Approach to Joint Denoising, Edge Detection and Motion Estimation. In Proc. DAGM
|
|
| M. van Dortmont, H. van de Wetering, A. Telea (2006) Skeletonization and Distance Transforms of 3D Volumes Using Graphics Hardware. In Proc. DGCI
|
|
| H. Byelas, E. Bondarev, A. Telea (2006) Visualization of Areas of Interest in Component-Based System Architectures. In Proc. EUROMICRO-SEAA. IEEE
|
|
| A. Telea, L. Voinea (2006) Mining Software Repositories with CVSgrab. In Proc. ACM MSR ($2^{nd}$ Prize MSR Challenge)
|
|
| A. Telea, L. Voinea (2006) An Open Framework for CVS Repository Querying, Analysis and Visualization. In Proc. ACM MSR
|
|
| L. Voinea, A. Telea (2006) CVSgrab: Mining the History of Large Software Projects. In Proc. EuroVis
|
|
| L. Voinea, J. Lukkien, A. Telea (2006) Visual Assessment of Software Evolution. Science of Computer Programming 65(3):222-248
|
|
| D. Reniers, A. Telea (2006) Quantitative Comparison of Tolerance-Based Feature Transforms. In Proc. VISAPP, pages 107-114
|
|
| A. Telea, R. Strzodka (2006) Multiscale Image Based Flow Visualization. In Proc. VDA. SPIE IS&T Press, pages 1-11
|
|
| L. Voinea, A. Telea (2006) CVSscan: Visualization of Software Evolution. In Proc. BENEVOL, pages 101-109 (also as CS Tech. Report 06-01, TU Eindhoven, Netherlands)
|
|
| L. Voinea, A. Telea (2006) Visual Data Mining and Analysis of Software Repositories. Computers & Graphics 31(3):410-428
|
|
| M. Termeer, J.O. Bescos, A. Telea (2006) Preserving Sharp Edges With Volume Clipping. In Proc. Vision Modeling and Visualization (VMV)
|
|
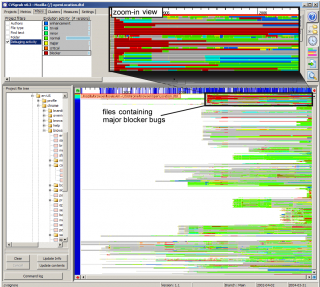
| L. Voinea, A. Telea (2006) How Do Changes in Buggy Mozilla Files Propagate? In Proc. ACM SOFTVIS (challenge Reports)
|
|
| D. Reniers, A. Telea (2006) Tolerance-Based Feature Transforms: A Quantitative Comparison. In Proc. ASCI
|
|
| T. Preusser, M. Rumpf, A. Telea (2006) Flow Field Post-Processing Via Partial Differential Methods. In Mathematical Foundations of Scientific Visualization, Computer Graphics, and Massive Data Exploration. (T. Möller, Eds.), Springer
|
|
| L. Voinea, A. Telea (2006) A File-Based Visualization of Software Evolution. In Proc. ASCI
|
|
| H. Byelas, A. Telea (2006) Visualization of Areas of Interest in Software Architecture Diagrams. In Proc. ACM SOFTVIS (Best paper award) (cover image at .../SoftVis06/aoi.jpg)
|
|
| L. Voinea, A. Telea (2006) Multiscale and Multivariate Visualizations of Software Evolution. In Proc. ACM SOFTVIS
|
|
| A.C. Telea (2006) Combining Extended Table Lens and Treemap Techniques for Visualizing Tabular Data. In Proc. EuroVis, pages 120-127
|
|
| M. Termeer, C. Lange, A. Telea, M. Chaudron (2005) Visual Exploration of Combined Architectural and Metric Information. In Proc. IEEE VISSOFT
|
|
| A. Telea, L. Voinea (2005) Interactive Visual Mechanisms for Exploring Source Code Evolution. In Proc. IEEE VISSOFT
|
|
| G. Lommerse, F. Nossin, L. Voinea, A. Telea (2005) The Visual Code Navigator: An Interactive Toolset for Source Code Investigation. In Proc. IEEE InfoVis (cover image on Proc. InfoVis 05)
|
|
| L. Voinea, A. Telea (2005) Visual Assessment Techniques for Component-Based Framework Evolution. In Proc. EUROMICRO-SEAA. IEEE
|
|
| D. Reniers, A. Telea (2005) Quantitative Comparison of Complete Distance Transforms for Skeletons. In Proc. SIREN (TU Delft)
|
|
| L. Voinea, J.J. van Wijk, A. Telea (2005) Software Evolution Visualization. In Proc. SIREN (TU Delft)
|
|
| D. Reniers, A. Telea (2005) Extreme Simplification and Rendering of Point Sets Using Algebraic Multigrid. Computing and Visualization in Science
|
|
| L. Voinea, A. Telea, J.J. van Wijk (2005) A Line-Based Visualization of Code Evolution. In Proc. ASCI
|
|
| D. Reniers, A. Telea (2005) Extreme Simplification and Rendering of Point Sets Using Algebraic Multigrid. In Proc. ASCI
|
|
| D. Parsons, A. Rashid, A. Telea, A. Speck (2005) An Architectural Pattern for Designing Component-Based Application Frameworks. Software: Practice & Experience 36(2):157-190
|
|
| L. Voinea, A. Telea, M. Chaudron (2005) Version-Centric Visualization of Code Evolution. In Proc. EuroVis
|
|
| L. Voinea, A. Telea, J.J. van Wijk (2005) CVSScan: Visualization of Code Evolution. In Proc. ACM SOFTVIS
|
|
| F. Frasincar, A. Telea, G.J. Houben (2005) Adapting Graph Visualization Techniques for the Visualization of RDF Data. In Visualizing the Semantic Web. (V. Geroimenko, C. Chen, Eds.), Springer
|
|
| J. Maubach, A. Telea (2005) The NumLab Numerical Laboratory for Computation and Visualisation. Computing and Visualisation in Science 8(1):1-17
|
|
| M. Sillanpaa, A. Telea (2005) Demonstration of the SoftVision Software Visualization Framework. In Tools for Software Maintenance and Reengineering. (M. di Penta, M. Harsu, Eds.), Franco Angeli, pages 88-108
|
|
| A. Telea, J.J. van Wijk (2004) 3D IBFV: Hardware Accelerated 3D Flow Visualization. In Proc. IEEE Visualization
|
|
| U. Clarenz, M. Rumpf, A. Telea (2004) Surface Processing Methods for Point Sets Using Finite Elements. Computers & Graphics 28(6)
|
|
| L. Voinea, A. Telea (2004) A Framework for Interactive Visualization of Component-Based Software. In Proc. EUROMICRO-SEAA. IEEE, pages 567-574
|
|
| L. Voinea, A. Telea, J.J. van Wijk (2004) EZEL: A Visual Assessment Tool for P2P File Sharing Networks. In Proc. IEEE InfoVis (cover image on Proc. InfoVis 04 .../InfoVis04/ezel.jpg)
|
|
| M. Griebel, M. Rumpf, T. Preusser, M.A. Schweitzer, A. Telea (2004) Flow Field Clustering Via Algebraic Multigrid. In Proc. IEEE Visualization
|
|
| U. Clarenz, M. Rumpf, A. Telea (2004) Finite Elements on Point Based Surfaces. In Proc. Symp. on Point Based Graphics (PBG)
|
|
| A. Telea, C. Sminchisescu, S. Dickinson (2004) Optimal Inference for Hierarchical Skeleton Abstractions. In Proc. IEEE ICPR (also as Tech. Report CSRG-480, Comp. Sci. Dept., U. Toronto, Canada, Jan. 2004)
|
|
| N. Goga, F. Moldoveanu, A. Telea (2004) Shading in a Distributed Environment. In Proc. IEEE Information Visualisation
|
|
| U. Clarenz, M. Rumpf, A. Telea (2004) Fairing of Point Based Surfaces. In Proc. Computer Graphics International (CGI)
|
|
| U. Clarenz, M. Rumpf, A. Telea (2004) Robust Feature Detection and Local Classification for Surfaces Based on Moment Analysis. IEEE TVCG 10(5):516-524
|
|
| U. Clarenz, M. Griebel, M. Rumpf, M.A. Schweitzer, A. Telea (2004) Feature Sensitive Multiscale Editing on Surfaces. Visual Computer 20(5) (also as Preprint 89, SFB 611, Inst. of Numerical Analysis, U. Bonn, Germany)
|
|
| R. Strzodka, A. Telea (2004) Generalized Distance Transforms and Skeletons in Graphics Hardware. In Proc. IEEE VisSym
|
|
| A. Telea (2004) An Open Architecture for Visual Reverse Engineering. In Managing Corporate Information Systems Evolution and Maintenance. (K. Khan, Eds.), Idea Group Inc (ISBN 1-59140-366-9)
|
|
| A. Telea (2004) An Image Inpainting Technique Based on the Fast Marching Method. J. Graphics Tools 9(1):25-36
|
We teach (and taught) many courses spanning all areas of visualization and graphics and for different audiences (BSc/MSc/PhD students, professionals). Details here.
We have supervised many students at all levels (BSc/MSc/PhD). Selected key results here.