The Visualization and Graphics Group (VIG), led by prof. dr. Alexandru C. Telea, creates visual analysis and rendering tools and methods to help scientists and researchers better process and understand large, multi-dimensional, and relational datasets in domains such as neuroscience, genomics, software engineering, astronomy, and medicine.
Our mission is to empower experts, as well as non-data scientists, to solve big data problems through visualizations, interaction concepts, data mining techniques, and realistic rendering methods.
VIG is part of the Department of Information and Computing Science, Utrecht University.
- visualization for AI (dimensionality reduction, explaining machine learning)
- big data multiscale visualization (hierarchies, graphs, trails, tables)
- visualization in practice (decision making, user studies)
- information visualization and visual analytics (techniques, system design, evaluation)
- photorealistic computer graphics (techniques, evaluation)
- shape/image processing (skeletonization, segmentation, fairing, reconstruction)
- scientific visualization (fluid simulation, GPU- and PDE-based techniques)
Latest Publications (full list here)
2026
| | B. Oral, W. Ubbink, E. Dimara, A. Chatzimparmpas (2026) Investigating Status Quo Effects in Visualization-Aided Choice. In IEEE Visualization and Visual Analytics (VIS) |
| | B. Oral, A. Telea, E. Dimara (2026) QueerTravel: Visualizing Social Safety Enriched with Community Experiences to Support Travel Decisions. IEEE Transactions on Visualization and Computer Graphics |
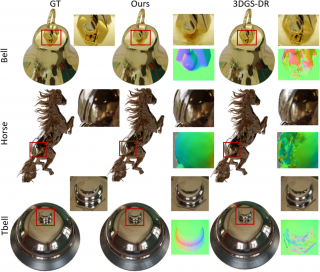 | J. Li, X. Wang, H. Zeng, X. Ye, J. Kosinka, A. Telea, Y. Zhang, Y. Xu (2026) PGSR-DR: High-Fidelity Reflective Surface Reconstruction with Planar-based Gaussians and Deferred Rendering. Visual Computer 42(9):404-421 |
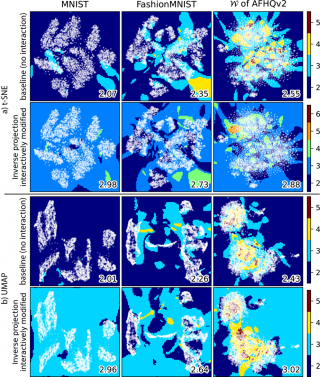 | Y. Wang, F.L. Dennig, M. Behrisch, A. Telea (2026) LCIP: Loss-Controlled Inverse Projection of High-Dimensional Image Data. Information Visualization |
| | L. Cibulski, T. Mertz, E. Dimara, S. Bruckner (2026) Evaluating Visual Decision Support: How Does Preference Elicitation Shape Metric Sensitivity? IEEE Transactions on Visualization and Computer Graphics |
We teach (and taught) many courses spanning all areas of visualization and graphics and for different audiences (BSc/MSc/PhD students, professionals). Details here.
We have supervised many students at all levels (BSc/MSc/PhD). Selected key results here.
Research valorization
Our work has led to two innovative start-ups
- SolidSource (2006-2012): Tools and services for the visual analysis of big software data for industrial software maintenance
- GraphPolaris (2024-present): Tools and services for analyzing and visualizing large relational data